Lesson Example Discussion Quiz: Class Homework |
Quiz Discussion |
Title: Pictographs, Frequent Tables, Histograms |
Grade: 1400-a Lesson: S4-L8 |
Explanation: Let us discuss a few questions on this topic and review the answers to every question. |
Quiz: Discussion in Class
| Problem Id | Problem | Options |
|---|---|---|
Steps 1 |
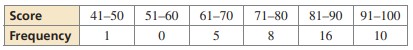
The frequency table shows the chemistry exam scores for a class. Display the data in a histogram. Describe the distribution.
|
A) 3 B) 0 C) 5 D) 7 |
Steps 2 |
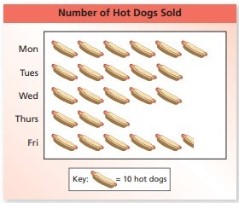
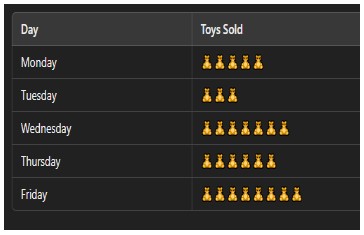
Which days sold the same number of hot dogs?
|
A) Monday and Tuesday B) Tuesday and Wednesday C) Thursday and Friday D) Monday and Wednesday |
Steps 3 |
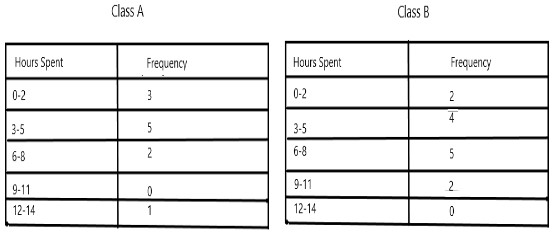
Which class has the highest number of students spending 6-8 hours on homework?
|
A) Class A B) Class B C) Both D) None |
Steps 4 |
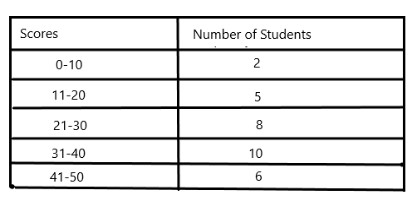
What is the total number of students who took the test?
|
A) 42 B) 40 C) 31 D) 35 |
Steps 5 |
How many toys were sold on Wednesday?
|
A) 79 B) 74 C) 72 D) 70 |
Copyright © 2020-2022 saibook.us Contact: info@saibook.us Version: 1.5 Built: 18-June-2024 09:20AM EST