Lesson Example Discussion Quiz: Class Homework |
Example |
Title: Pictographs, Frequent Tables, Histograms |
Grade: 1400-a Lesson: S4-L8 |
Explanation: The best way to understand SAT-2 is by looking at some examples. Take turns and read each example for easy understanding. |
Examples:
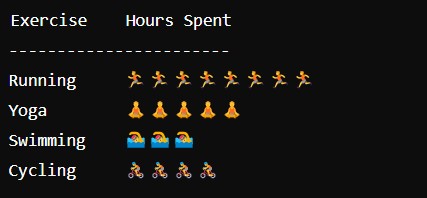
A person records the number of hours spent on different exercises in a week. The data is represented as follows:
Running: 15 hours
Yoga: 10 hours
Swimming: 5 hours
Cycling: 8 hours
Create a pictograph using a symbol where each symbol represents 2 hours.
Step 1a
|
|
Running - 🏃 Each symbol will represent 2 hours: |
|
Explanation: Here, we select a symbol to represent the quantity for each exercise and each symbol represents 2 hours. |
|
Step 1b
|
|
|
|
Explanation: Therefore, after allocating 2 hours to each activity, the total time will be 8 hours for running, 5 hours for Yoga, 3 hours for Swimming, and 4 hours for Cycling. |
|
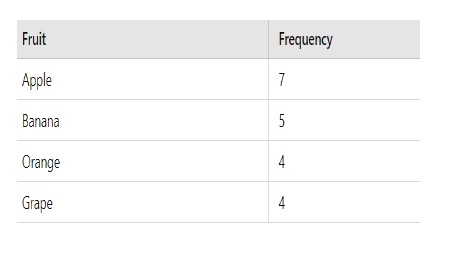
A survey of 20 people on their favorite fruit resulted in the following data:
Apple, Banana, Apple, Orange, Banana, Apple, Grape, Banana, Orange, Apple, Grape, Apple, Banana, Orange, Apple, Grape, Apple, Orange, Banana, and Grape.
Create a frequency table for the favorite fruits.
Step 2a
|
|
Apple - 7 |
|
Explanation: Here, we count the frequency of each fruit. |
|
Step 2b
|
|
|
|
Explanation: Therefore, after organizing the data into frequency tables, the counts are as follows: 7 Apples, 5 Bananas, 4 Oranges, and 4 Grapes. |
|
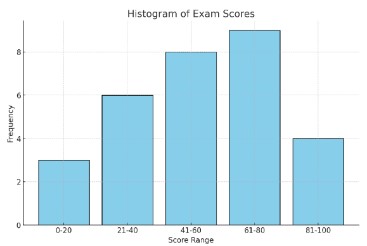
The following table represents the exam scores (out of 100) of 30 students in a class:

Create a histogram to represent the frequency distribution of the exam scores.
Step 3a
|
|
X-axis = Score range, Y-axis = Frequency |
|
Explanation: Here, we draw the x-axis, and y-axis and drawbars to represent scores based on their frequency. |
|
Step 3b
|
|
|
|
Explanation: Therefore, the histogram provides a visual representation of the distribution of scores, making it easy to see which score ranges are most and least common in the class. |
|
Copyright © 2020-2022 saibook.us Contact: info@saibook.us Version: 1.5 Built: 18-June-2024 09:20AM EST