Lesson Example Discussion Quiz: Class Homework |
Quiz At Home |
Title: Pictographs, Frequent Tables, Histograms |
Grade: 1400-a Lesson: S4-L8 |
Explanation: Hello Students, time to practice and review. Let us take next 10-15 minutes to solve the ten problems using the Quiz Sheet. Then submit the quiz to get the score. This is a good exercise to check your understanding of the concepts. |
Quiz: at Home
| Problem Id | Problem | Options |
|---|---|---|
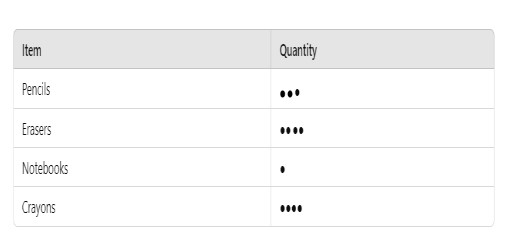
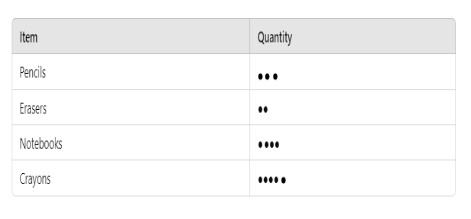
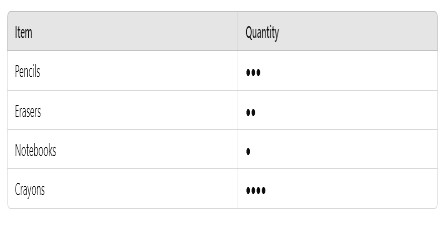
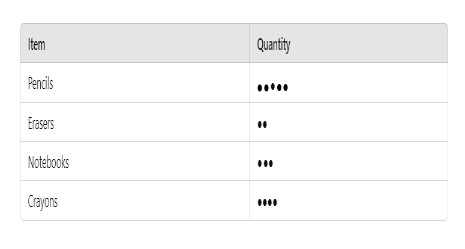
1 |
A classroom has the following school supplies: Pencils: 15 |
A) B) C) D) |
2 |
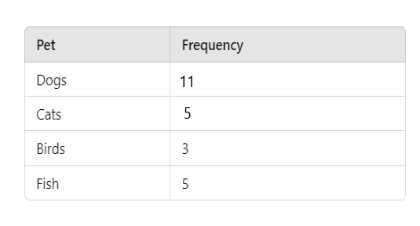
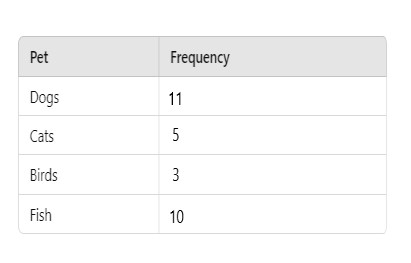
A neighborhood survey recorded the types of pets in each household. The results are as follows: Dogs: 10 households |
A) B) C) None of this D) |
3 |
The test scores of 20 students are as follows: 50, 55, 60, 65, 70, 75, 80, 85, 90, 95, 60, 65, 70, 75, 80, 85, 90, 95, 50, and 55. Construct a histogram to represent the student’s distribution. |
A) Skewed B) Uniform C) Symmetric D) unsymmetric |
4 |
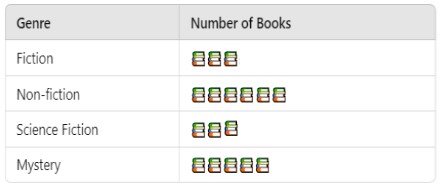
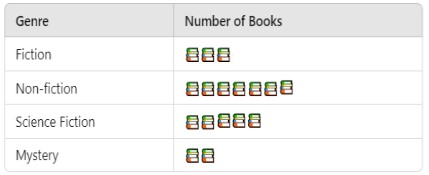
A library has books in different genres: Fiction: 30 books |
A) B) C) D) None of this |
5 |
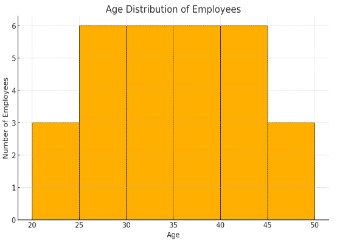
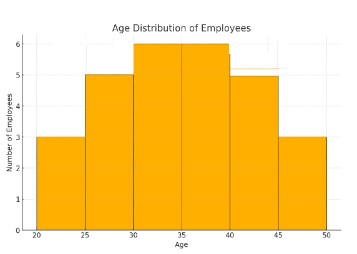
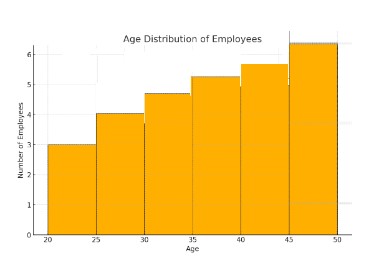
The ages of 30 employees in a company are as follows: 22, 25, 27, 30, 32, 35, 37, 40, 42, 45, 22, 25, 27, 30, 32, 35, 37, 40, 42, 45, 22, 25, 27, 30, 32, 35, 37, 40, 42, and 45. |
A) B) C) None of this D) |
6 |
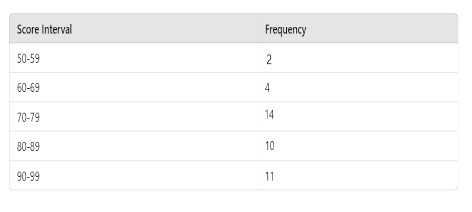
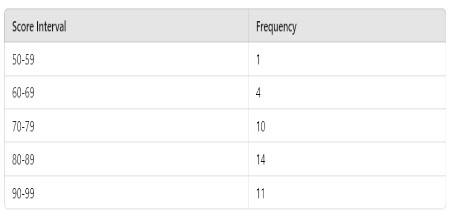
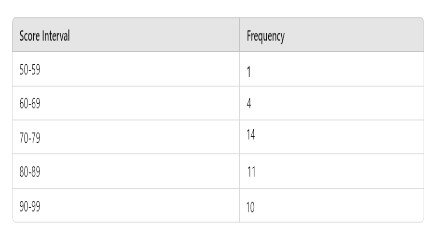
In a class of 40 students, the exam scores are as follows: 70, 85, 65, 90, 75, 80, 55, 95, 60, 85, 75, 80, 85, 90, 95, 70, 75, 80, 85, 90
65, 70, 75, 80, 85, 90, 95, 60, 75, 80, 85, 90, 95, 70, 75, 80, 85, 90, and 95. |
A) B) C) D) None of this |
7 |
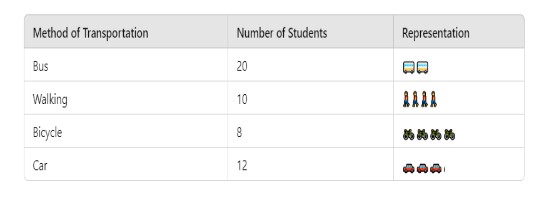
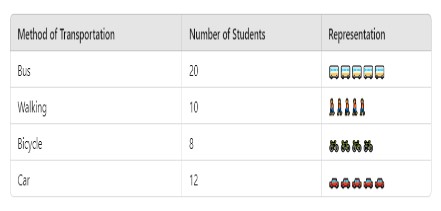
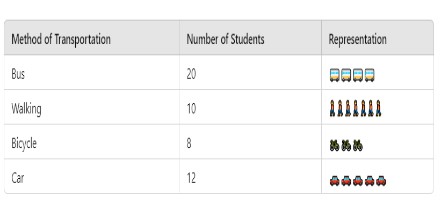
You surveyed 50 students about how they usually travel to school. The results are as follows: 20 students take the bus, 10 students walk, 8 students ride bicycles, and 12 students get dropped off by car. Create a pictograph to represent this data, where each symbol (e.g., a bus) represents 5 students. |
A) B) C) None of this D) |
8 |
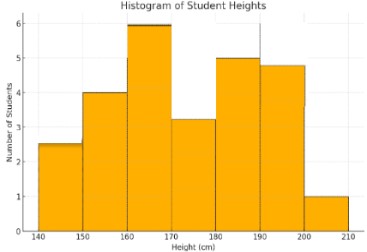
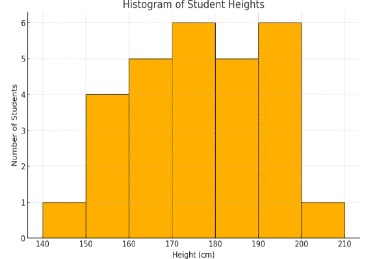
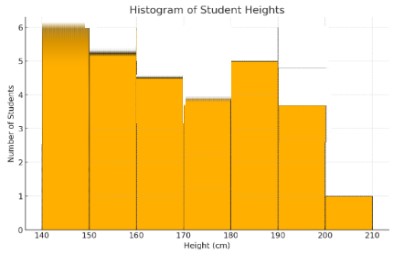
The heights (in cm) of 28 students are as follows: 150, 155, 160, 165, 170, 175, 180, 185, 190, 195, 155, 160, 165, 170, 175, 180, 185, 190, 195, 150, 182, 179, 166, 190, 176, 144, 199, and 200. |
A) B) None of this C) D) |
9 |
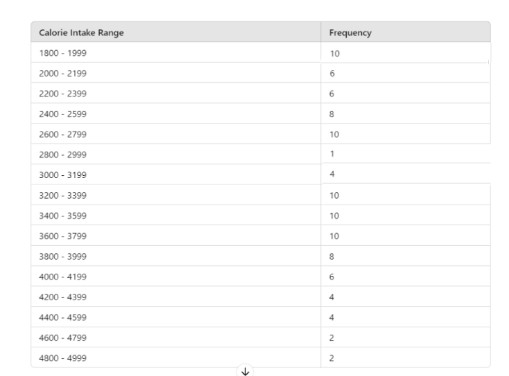
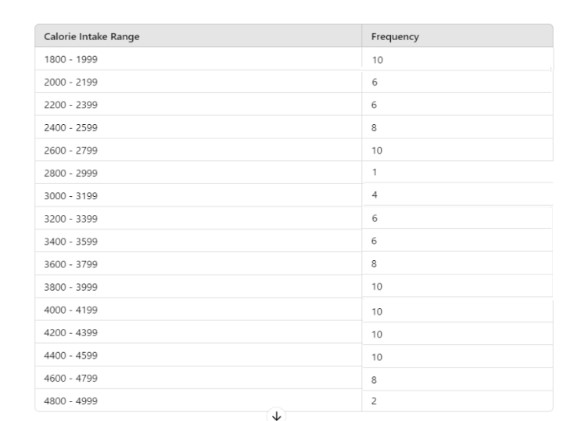
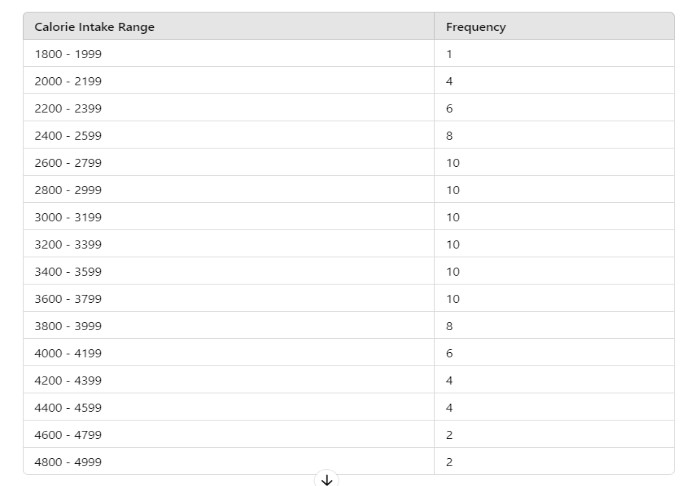
A nutritionist collected data on the daily calorie intake of 70 individuals. The data is as follows: 1800, 2000, 2200, 2400, 2600, 2800, 3000, 3200, 3400, and 3600, |
A) B) C) D) None of this |
10 |
The weekly earnings (in dollars) of 30 part-time workers are as follows: 200, 370, 180, 250, 270, 300, 320, 350, 370, 400, 160, 420, 220, 250, 270, 300, 160, 320, 350, 370, 400, 320, 200, 220, 250, 270, 300, 190, 320, and 380. |
A) Uniform B) Symmetrics C) unsymmetric D) Skewed |


Copyright © 2020-2022 saibook.us Contact: info@saibook.us Version: 1.5 Built: 18-June-2024 09:20AM EST