Lesson Example Discussion Quiz: Class Homework |
Quiz In Class |
Title: Pictographs, Frequent Tables, Histograms |
Grade: 1400-a Lesson: S4-L8 |
Explanation: Hello Students, time to practice and review. Let us take next 10-15 minutes to solve the ten problems using the Quiz Sheet. Then submit the quiz to get the score. This is a good exercise to check your understanding of the concepts. |
Quiz: in Class
| Problem Id | Problem | Options |
|---|---|---|
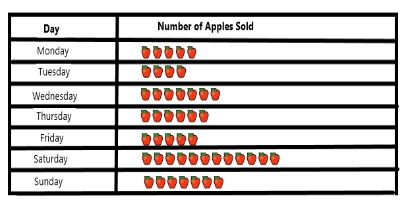
1 |
Calculate the total number of apples sold in the week.
|
A) 490 apples B) 475 apples C) 460 apples D) 510 apples |
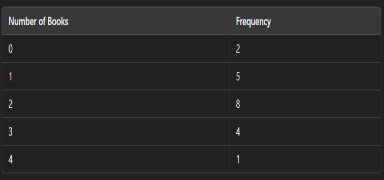
2 |
What is the mode of the number of books read?
|
A) 10 B) 7 C) 5 D) 2 |
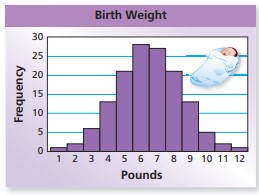
3 |
How many weigh 7 pounds?
|
A) 28 B) 26 C) 31 D) 35 |
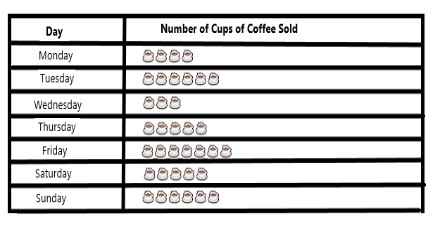
4 |
What is the average number of cups of coffee sold per day?
|
A) 25.7 B) 27.3 C) 29.5 D) 31.4 |
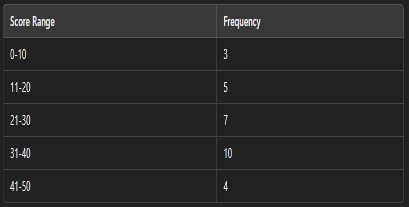
5 |
What percentage of students scored 30 or less?
|
A) 51.70% B) 52.80% C) 53.60% D) 54.90% |
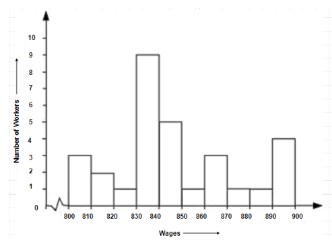
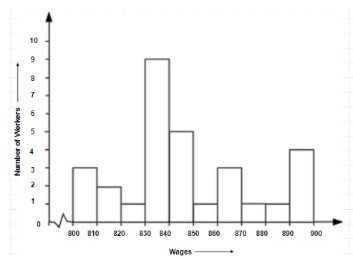
6 |
Which group has the maximum number of workers?
|
A) 820 - 830 B) 830 - 840 C) 800 - 810 D) 890 - 900 |
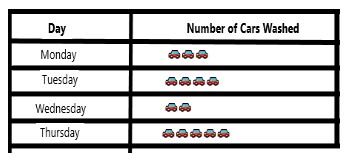
7 |
How many fewer cars were washed on Wednesday compared to Thursday?
|
A) 14 cars B) 12 cars C) 16 cars D) 18 cars |
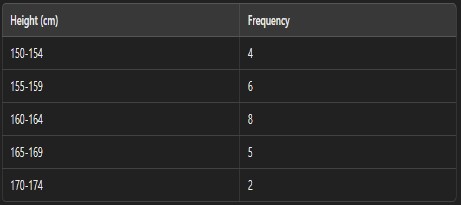
8 |
How many students have a height between 160 cm and 164 cm?
|
A) 12 students B) 10 students C) 8 students D) 12 students |
9 |
How many workers earn less than ₹ 850?
|
A) 30 B) 25 C) 20 D) 35 |
10 |
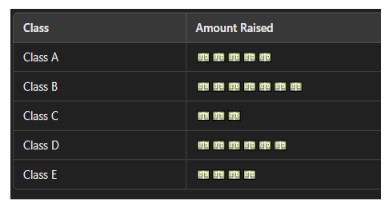
How much more money did Class B raise compared to Class C?
|
A) $90 B) $45 C) $85 D) $80 |
Copyright © 2020-2022 saibook.us Contact: info@saibook.us Version: 1.5 Built: 18-June-2024 09:20AM EST