Lesson Topics Discussion Quiz: Class Homework |
Definition1 |
Title: Graphs |
Grade Lesson s6-l7 |
Explanation: The best way to understand SAT-4 is by looking at some definitions. Take turns and read each definition for easy understanding. |
Definition
Topics → Definition Example1 Example2 Example3
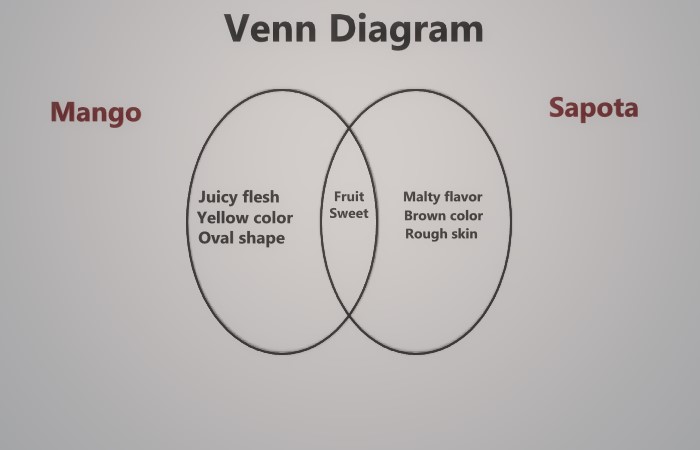
Definition: Venn Diagrams |
|
A Venn Diagram is a visual tool used to represent sets and their relationships to each other through overlapping circles or other shapes. Each circle represents a set, and the overlapping areas between circles represent the intersections of the sets, showing the common elements between them. |
|
Explanation: This Venn diagram shows that mangoes and sapotas are both fruits, but they have some different characteristics. |
|
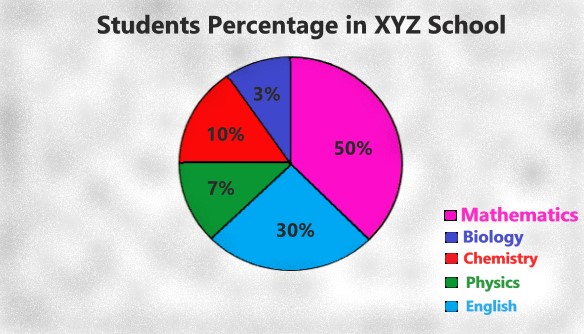
Definition: Circle graphs |
|
A circle graph is a visual representation of data, made by dividing a circle into sectors that each represent parts of a whole. Usually, the amounts in each sector are represented in percent, so that all of the amounts total 100%. |
|
Explanation: The pie chart depicts the distribution of students in XYZ school across five subjects: Mathematics (50%), Biology (3%), Physics (7%), Chemistry (10%), and English (30%). |
|
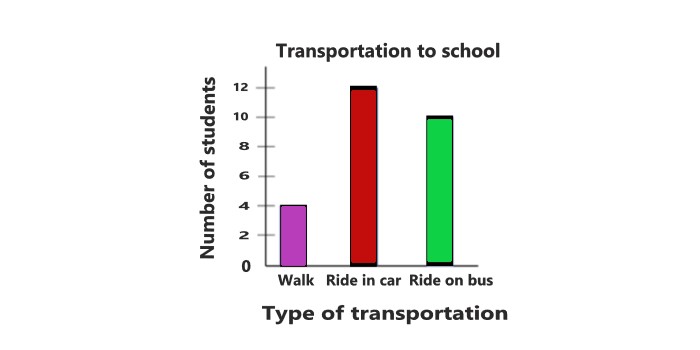
Definition: Bar and Line Graphs |
|
A bar graph (or bar chart) is a graphical representation of data using rectangular bars, where the length of each bar is proportional to the value it represents. Bar graphs are used to compare different categories of data and are particularly useful for showing discrete data. |
|
Explanation: The bar graph shows how many students use different modes of transportation to get to school, with most walking and the least riding the bus. |
|
Copyright © 2020-2024 saibook.us Contact: info@saibook.org Version: 4.0 Built: 04-Apr-2025 12:00PM EST