Lesson Topics Discussion Quiz: Class Homework |
Example1 |
Title: Graphs |
Grade Lesson s6-l7 |
Explanation: The best way to understand SAT-4 is by looking at some examples. Take turns and read each example for easy understanding. |
Examples
Topics → Definition Example1 Example2 Example3
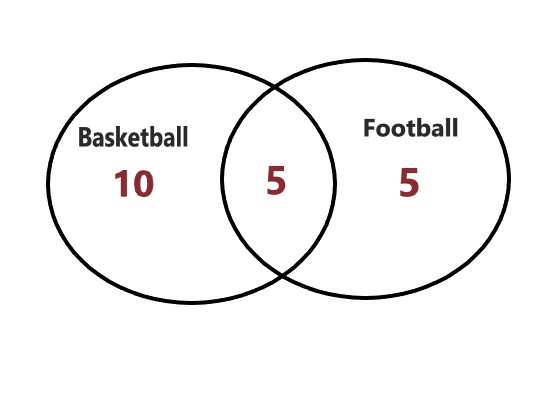
In a group of 30 students:
a) 15 students play football.
b) 10 students play basketball.
c) 5 students play both football and basketball.
We need to draw a Venn diagram and find out how many students play only football, only basketball, and neither sport.
Step: 1 |
|
Draw two overlapping circles: |
|
Explanation: Here, we draw the two overlapping circles. One circle is for Football, and the other circle is for Basketball. And overlapping area is 5. |
|
Step: 2 |
|
The number of students who play only football in the football circle but outside the overlapping area: 15 - 5 = 10. The number of students who play only basketball in the basketball circle but outside the overlapping area: 10 - 5 = 5. Calculate the number of students who play neither sport: 30 - (10 + 5 + 5) = 10 → 10 students play only football (outside the overlap area, within the Football circle). |
|
Explanation: Here, 10 students play football, 5 students play football and basketball, 5 students play basketball, and 10 students play neither sport. |
|
Step: 3 |
|
|
|
Explanation: Here, we draw the all values in the Venn diagram. |
|
Copyright © 2020-2024 saibook.us Contact: info@saibook.org Version: 4.0 Built: 04-Apr-2025 12:00PM EST