Lesson Topics Discussion Quiz: Class Homework |
Quiz Discussion |
Title: Graphs |
Grade Lesson s6-l7 |
Explanation: Let us discuss a few questions on this topic and review the answers to every question. |
Quiz: Discussion
| Id | Name | Note |
|---|---|---|
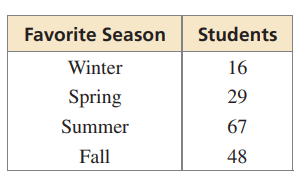
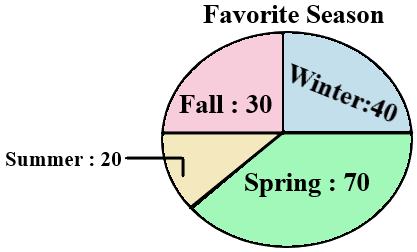
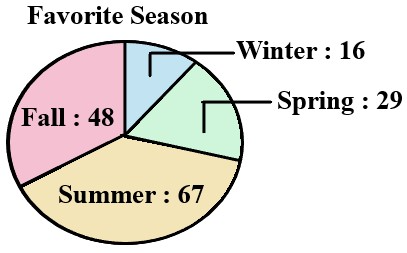
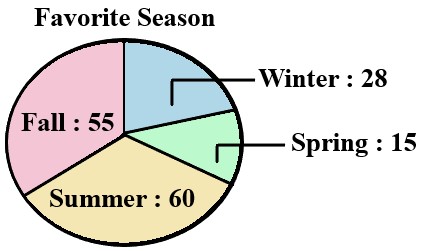
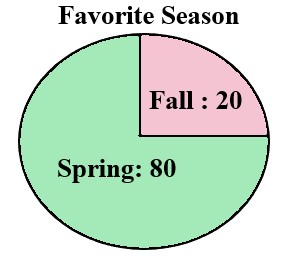
The table shows the results of a survey.
|
A) B) C) D) |
|
Use the Venn diagrams you drew in Exercises 1–3 to decide whether the statement is true or false. Explain your reasoning. |
A) FALSE B) Both C) TRUE D) None of this |
|
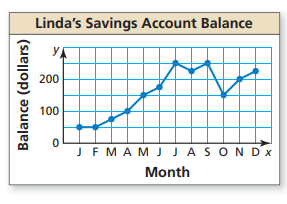
Use the line graph to answer each question.
|
A) January and May B) June and July C) October and December D) May and October |
|
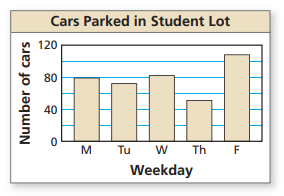
Use the bar graph to answer each question.
|
A) Friday B) Monday C) Sunday D) Tuesday |
|
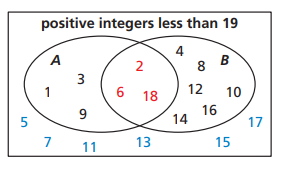
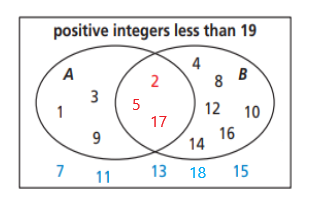
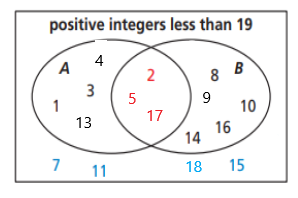
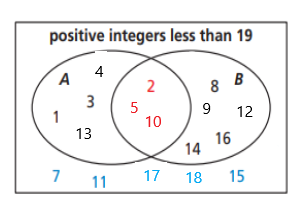
Draw a Venn diagram of the positive integers less than 19, where set A consists of factors of 18 and set B consists of even numbers. |
A) B) C) D) |
Copyright © 2020-2024 saibook.us Contact: info@saibook.org Version: 4.0 Built: 04-Apr-2025 12:00PM EST