Lesson Topics Discussion Quiz: Class Homework |
Example1 |
Title: Graphs |
Grade Lesson s6-l7 |
Explanation: The best way to understand SAT-4 is by looking at some examples. Take turns and read each example for easy understanding. |
Examples
Topics → Definition Example1 Example2 Example3
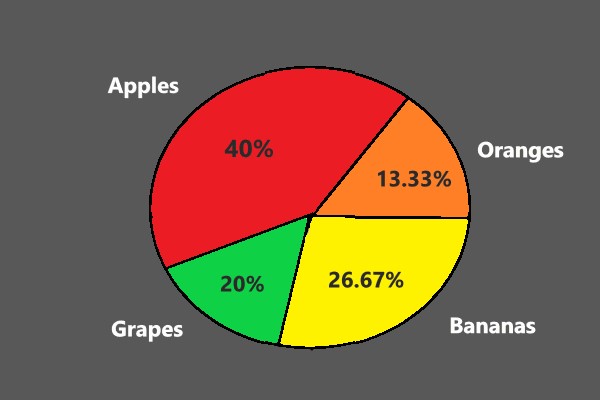
A class of 30 students was surveyed about their favorite fruit. The results are as follows:
Apples: 12 students
Bananas: 8 students
Grapes: 6 students
Oranges: 4 students
We need to create a circle graph to represent this data.
Step: 1 |
|
Total students = 30 Bananas: \$8/(30) \times100% = 26.67% \$ Grapes: \$6/(30) \times 100% = 20%\$ Oranges: \$4/(30) \times 100% = 13.33% \$ Draw a circle: |
|
Explanation: Here, we calculate the percentage of each fruit and draw a circle to divide the values. |
|
Step: 2 |
|
|
|
Explanation: Here, we draw the graph. Therefore, apples account for 40%, bananas for 26.67%, grapes for 20%, and oranges for 13.33%. |
|
Copyright © 2020-2024 saibook.us Contact: info@saibook.org Version: 4.0 Built: 04-Apr-2025 12:00PM EST