Lesson Topics Discussion Quiz: Class Homework |
Quiz In Class |
Title: Graphs |
Grade Lesson s6-l7 |
Explanation: Hello Students, time to practice and review. Let us take next 10-15 minutes to solve the ten problems using the Quiz Sheet. Then submit the quiz to get the score. This is a good exercise to check your understanding of the concepts. |
Quiz: in Class
| Id | Name | Note |
|---|---|---|
1 |
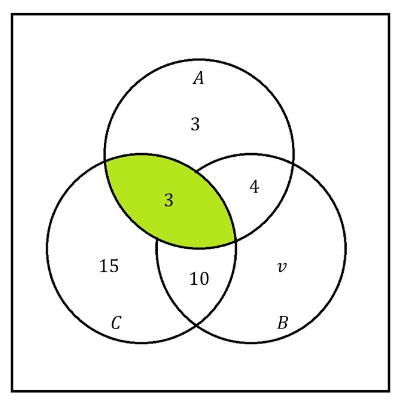
How many elements are there in set A only?
|
A) 3 B) 5 C) 7 D) 9 |
2 |
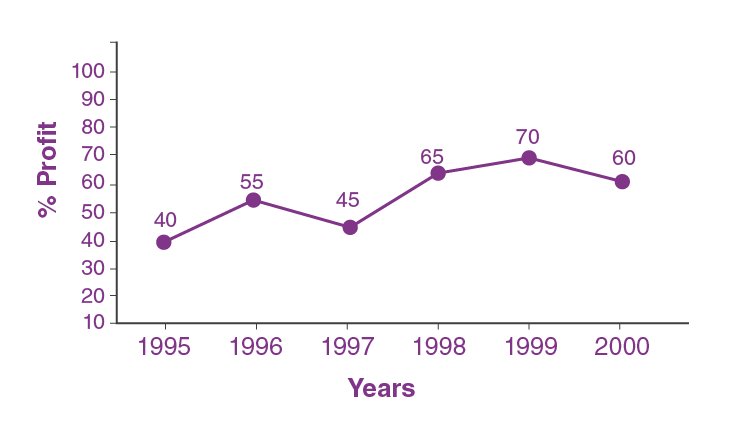
What was the percentage of profit in the year 1997?
|
A) 47% B) 52% C) 49% D) 45% |
3 |
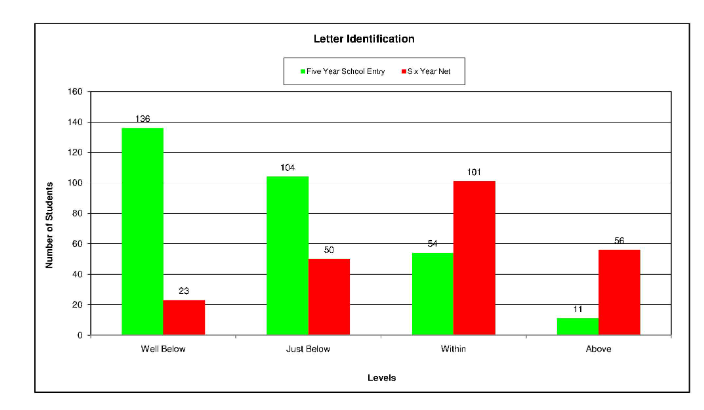
What is the total number of students across both groups who are within the level of letter identification?
|
A) 159 B) 155 C) 157 D) 161 |
4 |
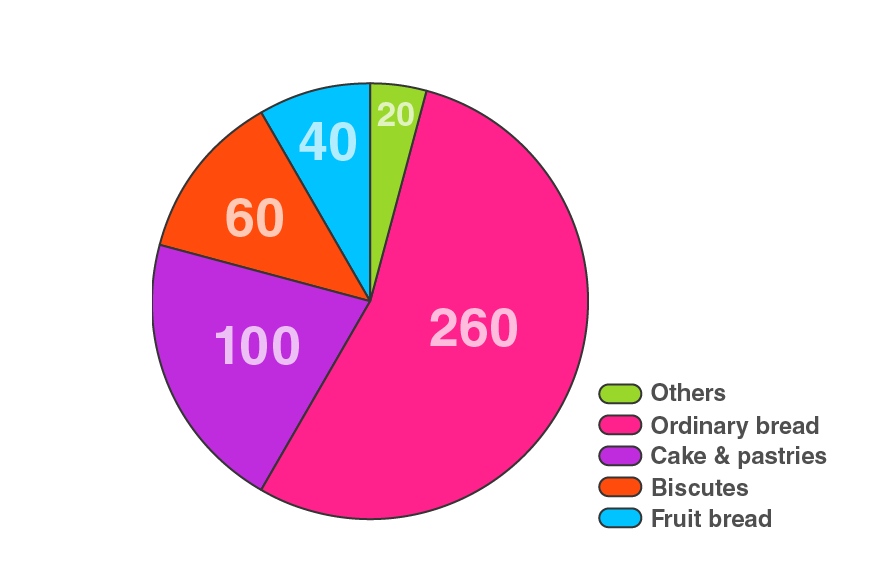
If the total number of products were to increase by 50%, how many products would there be in the 'Fruit bread' category?
|
A) 62 B) 64 C) 60 D) 66 |
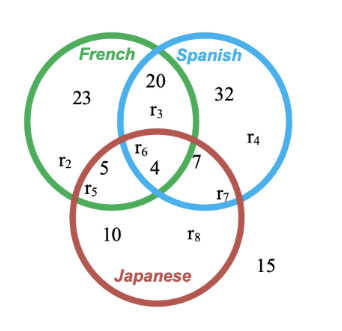
5 |
How many people can speak both French and Spanish but not Japanese?
|
A) 22 B) 26 C) 24 D) 20 |
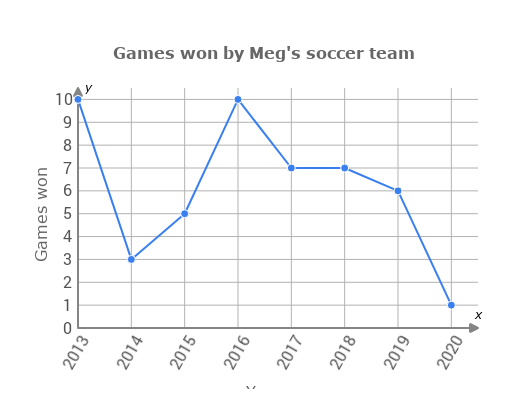
6 |
How many games did Meg’s soccer team win in 2014?
|
A) 9 games B) 6 games C) 3 games D) 5 games |
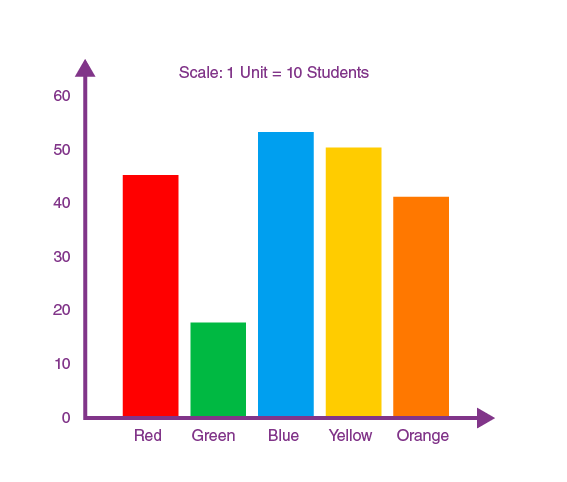
7 |
How many students like red and yellow colors?
|
A) 95 B) 150 C) $152 D) 154 |
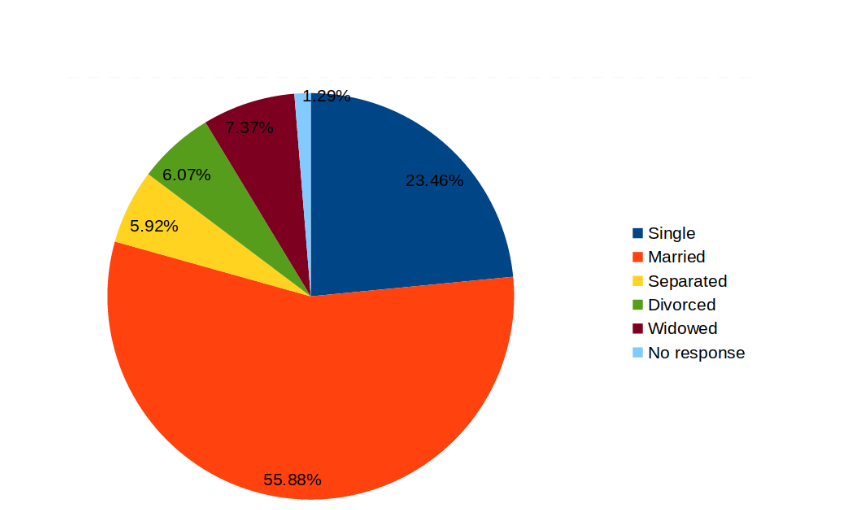
8 |
What percentage of divorced individuals is represented in the chart?
|
A) 7.37% B) 6.07% C) 5.92% D) 1.29% |
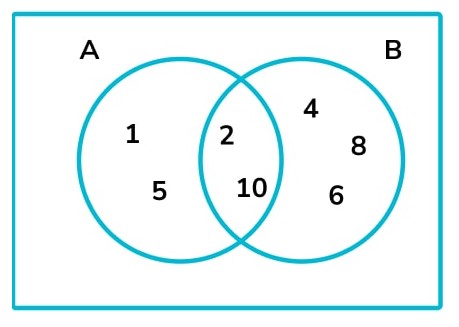
9 |
How many elements are there in set A only?
|
A) 4 B) 5 C) 2 D) 10 |
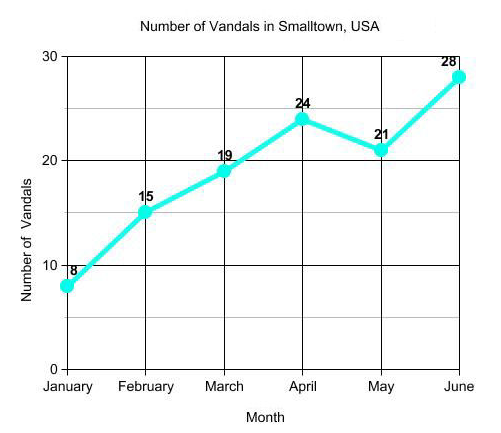
10 |
What was the month with the most visitors?
|
A) June B) March C) May D) April |
Copyright © 2020-2024 saibook.us Contact: info@saibook.org Version: 4.0 Built: 04-Apr-2025 12:00PM EST