Lesson Example Discussion Quiz: Class Homework |
Quiz Discussion |
Title: Box and Whisker Plots, Identifying Outliers |
Grade: 1400-a Lesson: S4-L6 |
Explanation: Let us discuss a few questions on this topic and review the answers to every question. |
Quiz: Discussion in Class
| Problem Id | Problem | Options |
|---|---|---|
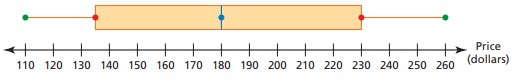
Steps 1 |
The data set shows the prices (in dollars) of lacrosse helmets. Make a box-and-whisker plot
that represents the data. Describe the distribution: |
A) B) C) D) |
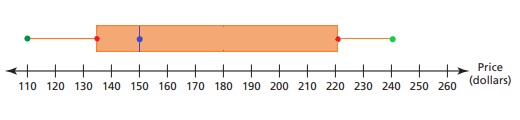
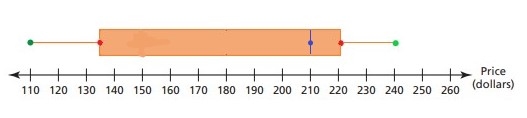
Steps 2 |
Make a box-and-whisker plot that represents the data. Describe the distribution.
Video game prices (in dollars): |
A) Symmetric B) Skewed Left C) Skewed Right D) None of the above |
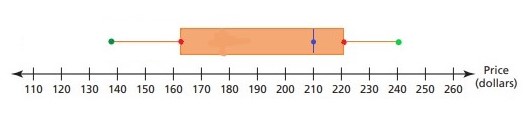
Steps 3 |
Find any outliers in the test scores for a class: |
A) Outlier: 55 B) Outlier: 80 C) Outlier: 120 D) Outlier: 60 |
Steps 4 |
Find the interquartile range (IQR): |
A) 11 B) 13 C) 9 D) 17 |
Steps 5 |
Identify any outlier(s) of the data set: |
A) 94, 96 B) 93, 92 C) 95, 98 D) 93, 96 |
Copyright © 2020-2022 saibook.us Contact: info@saibook.us Version: 1.5 Built: 18-June-2024 09:20AM EST