Lesson Example Discussion Quiz: Class Homework |
Step-1 |
Title: Box and Whisker Plots, Identifying Outliers |
Grade: 1400-a Lesson: S4-L6 |
Explanation: Hello Students, time to practice and review the steps for the problem. |
Lesson Steps
| Step | Type | Explanation | Answer |
|---|---|---|---|
1 |
Problem |
The data set shows the prices (in dollars) of lacrosse helmets. Make a box-and-whisker plot
that represents the data. Describe the distribution. |
|
2 |
Step |
The given data is ordered in ascending order: |
|
3 |
Step |
Calculate the Five-Number Summary → Minimum: The smallest value in the data set is 110. → First Quartile (Q1): The median of the lower half of the data → Median (Q2): The median of the entire data set → Third Quartile (Q3): The median of the upper half of the data → Maximum: The largest value in the data set is 260. |
|
4 |
Step |
Constructing the Box-and-Whisker Plot. → Draw a number line that covers the range of your data, from 110 to 260. |
|
5 |
Step |
Description of the Distribution. → The data is spread out with prices ranging from $110 to $260. |
|
6 |
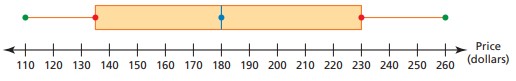
Choice.A |
This plot correctly depicts a box-and-whisker plot for the lacrosse helmet price data. The minimum value (least price) is represented by the leftmost point on the number line. The box shows the spread of the data between Q1 and Q3. The line in the middle of the box represents the median (Q2). The whiskers extend from the box towards the minimum and maximum values, likely following the 1.5 IQR rule from the quartiles |
|
7 |
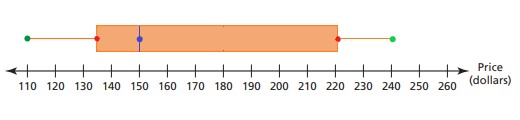
Choice.B |
The box in this plot is wider than expected for the IQR, and the whiskers extend to data points that might be outliers but are included within the whiskers |
|
8 |
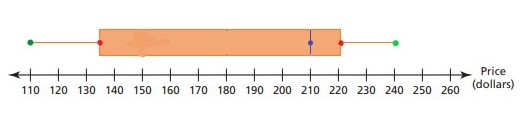
Choice.C |
The median line is missing in the box, and the whiskers seem to extend beyond potential outliers |
|
9 |
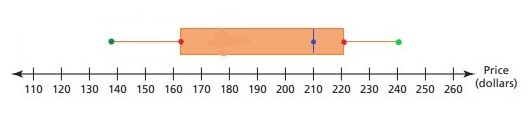
Choice.D |
The box is too short, and the left whisker extends to a data point that likely falls within the 1.5 IQR range |
|
10 |
Answer |
Option |
A |
11 |
Sumup |
Can you summarize what you’ve understood in the above steps? |
|
Copyright © 2020-2022 saibook.us Contact: info@saibook.us Version: 1.5 Built: 18-June-2024 09:20AM EST