Lesson Example Discussion Quiz: Class Homework |
Quiz At Home |
Title: Box and Whisker Plots, Identifying Outliers |
Grade: 1400-a Lesson: S4-L6 |
Explanation: Hello Students, time to practice and review. Let us take next 10-15 minutes to solve the ten problems using the Quiz Sheet. Then submit the quiz to get the score. This is a good exercise to check your understanding of the concepts. |
Quiz: at Home
| Problem Id | Problem | Options |
|---|---|---|
1 |
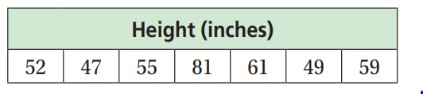
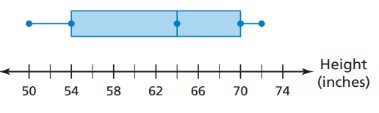
The table shows the heights of seven students. Identify any outlier(s).
|
A) 55 is an outlier B) 47 is an outlier C) 81 is an outlier D) 61 is an outlier |
2 |
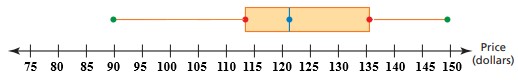
The temperatures (in degrees Celsius) recorded in a city over 30 days are as follows: Construct a box and whisker plot to represent the temperature distribution. |
A) Skewed Right B) Symmetric C) Skewed Left D) None of this |
3 |
Find the interquartile range(IQR).
|
A) 5 B) 11 C) 9 D) 7 |
4 |
The following are the scores obtained by 20 students in a mathematics test Create a box and whisker plot to represent the distribution of scores. |
A) B) C) D) |
5 |
Find the interquartile range, and Identify any outlier(s).
|
A) IQR = 16, outlier is 72 B) IQR = 15, outlier is 50 C) IQR = 16 ,no outlier D) IQR = 15, outlier is 72 |
6 |
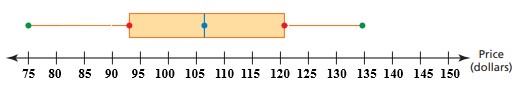
The following are the heights (in centimeters) of students in a class: Create a box and whisker plot to display the distribution of heights. |
A) Skewed Right B) None of this C) Symmetric D) Skewed Left |
7 |
Identify any outliers in the following data set of house prices (in thousands of dollars): |
A) Outlier: 400 B) Outlier: 320 C) Outlier: 180 D) Outlier: 390 |
8 |
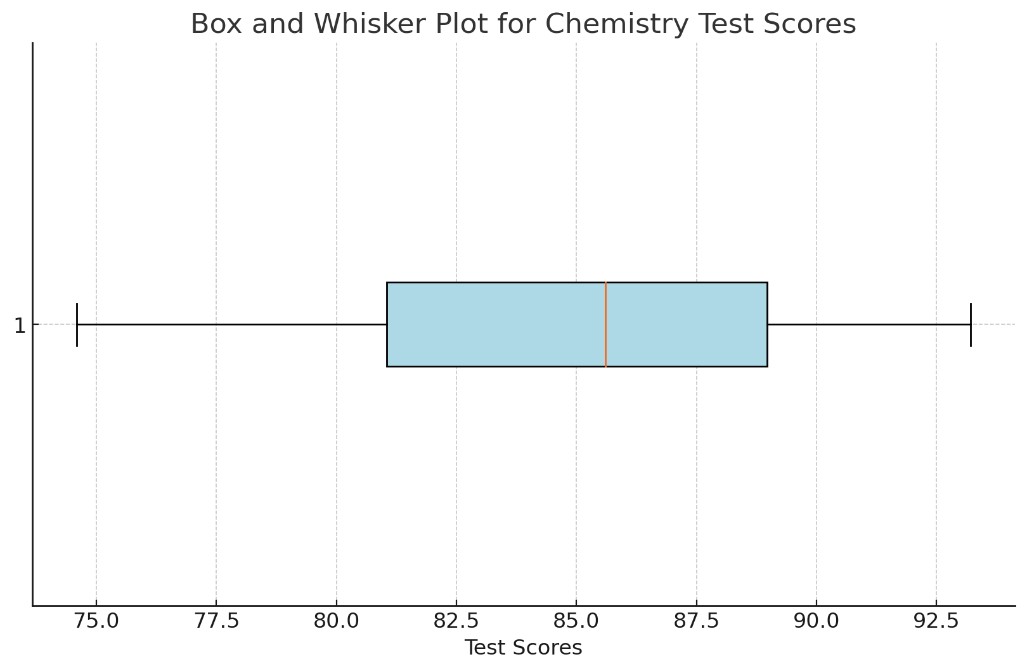
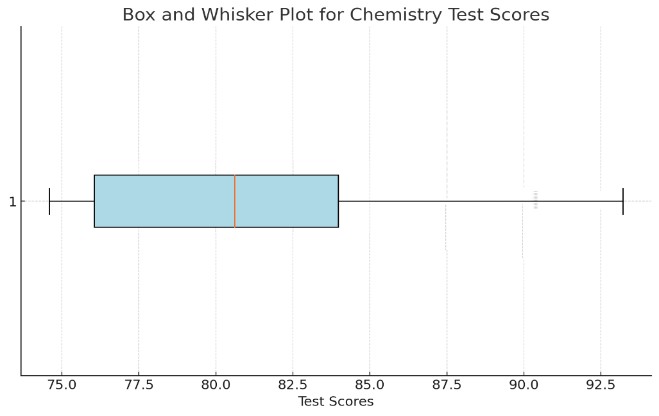
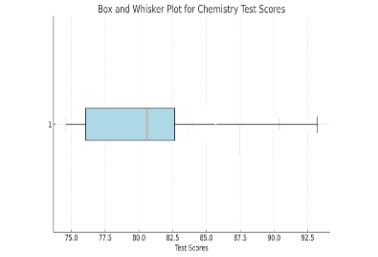
The following are the test scores (out of 100) for a group of students in a chemistry class: Draw a Box and Whisker plot for the test scores. |
A) B) C) D) None of this |
9 |
Identify any outliers in the following data set of monthly expenses (in dollars): |
A) Outlier: 800.0 B) Outlier: 500.8 C) Outlier: 320.5 D) Outlier: 330.2 |
10 |
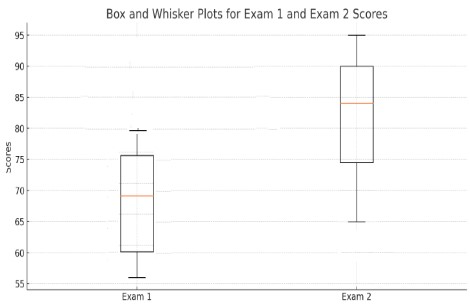
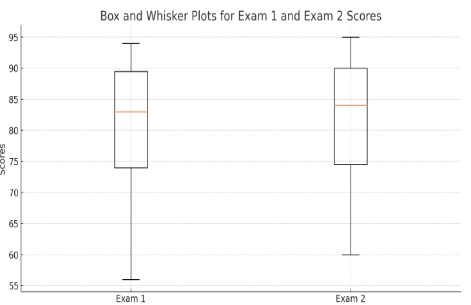
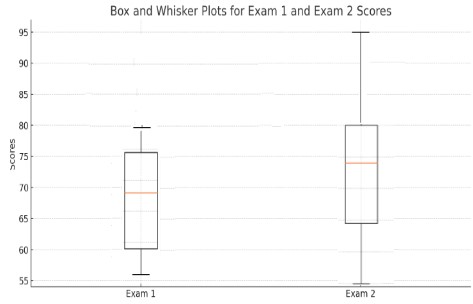
A group of students took two different exams. Their scores for Exam 1 and Exam 2 are as follows: Exam 1: 56, 75, 89, 65, 92, 78, 85, 90, 83, 73, 68, 77, 94, 88, and 91. Construct Box and Whisker plots for both Exam 1 and Exam 2 scores. |
A) B) C) D) None of this |
Copyright © 2020-2022 saibook.us Contact: info@saibook.us Version: 1.5 Built: 18-June-2024 09:20AM EST