Lesson Example Discussion Quiz: Class Homework |
Quiz In Class |
Title: Box and Whisker Plots, Identifying Outliers |
Grade: 1400-a Lesson: S4-L6 |
Explanation: Hello Students, time to practice and review. Let us take next 10-15 minutes to solve the ten problems using the Quiz Sheet. Then submit the quiz to get the score. This is a good exercise to check your understanding of the concepts. |
Quiz: in Class
| Problem Id | Problem | Options |
|---|---|---|
1 |
The following data represents the number of goals scored by a soccer team in each match of a season: |
A) B) C) D) |
2 |
Consider the following dataset representing the number of daily steps taken by a group of individuals over a week: 5000, 5200, 5300, 5500, 5600, 5800, 6000, 6200, 6300, 6500, 6700, 6900, 7100, 7300, 7500, and 12000. Determine if there are any outliers in the dataset using the \$1.5 \times "IQR"\$ rule. Create a box plot to visualize the data and identify any outliers. |
A) 13000 B) 12000 C) 12500 D) 13500 |
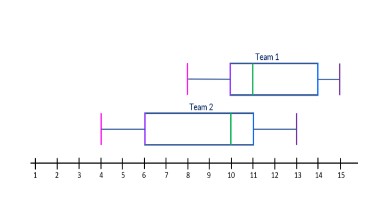
3 |
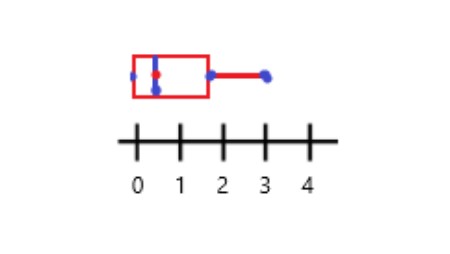
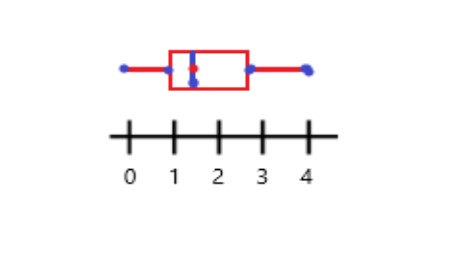
Which team has the greatest spread?
|
A) None B) Both C) Team 1 D) Team 2 |
4 |
You have the following dataset representing the scores of students in a math test: |
A) 49.23, 114.23 B) 47.56, 112.75 C) 45.23, 113.69 D) 42.75, 112.75 |
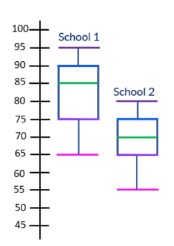
5 |
Calculate the IQR for school 1.
|
A) 13 B) 17 C) 15 D) 20 |
6 |
Given the dataset of daily temperatures (in °F) recorded over a month: |
A) 90, 98 B) 95, 96 C) 90, 95 D) 92, 97 |
7 |
Given the following data set: |
A) Min: 12 B) Min: 14 C) Min: 12 D) Min: 22 |
8 |
The following data represents the scores of 10 students in a mathematics quiz: 6, 7, 8, 8, 9, 10, 11, 12, 14, and 16. Calculate the interquartile range. |
A) 5 B) 7 C) 9 D) 11 |
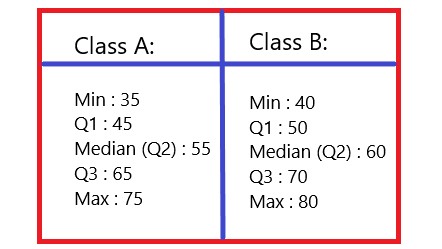
9 |
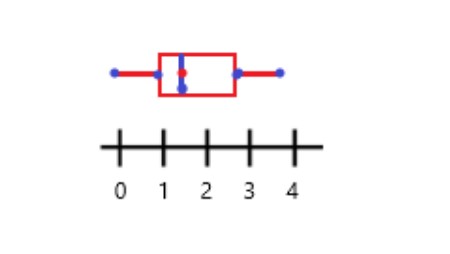
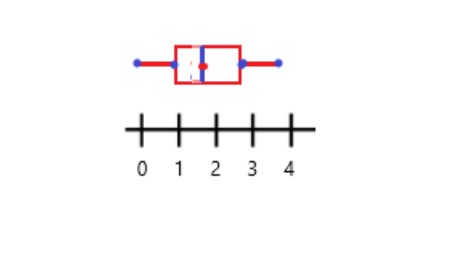
Which class has a greater interquartile range (IQR)?
|
A) Class A B) Both C) Class B D) None |
10 |
The following data represents the test scores of 12 students in a class: 78, 80, 82, 85, 88, 90, 91, 92, 94, 96, 98, and 150. Calculate the interquartile range and identify any outliers. |
A) IQR: 12.3, Outlier: 152 B) IQR: 11.5, Outlier: 150 C) IQR: 13.5, Outlier: 155 D) IQR: 11.5, Outlier: 157 |
Copyright © 2020-2022 saibook.us Contact: info@saibook.us Version: 1.5 Built: 18-June-2024 09:20AM EST