Lesson Topics Discussion Quiz: Class Homework |
Steps-1 |
Title: Visualizing Data |
Grade Lesson s6-l8 |
Explanation: Hello Students, time to practice and review the steps for the problem. |
Quiz: Discussion Step
| Id | Type | Name | Note |
|---|---|---|---|
1 |
Problem |
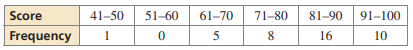
The frequency table shows the chemistry exam scores for a class. Create a histogram and describe the distribution. What best describes the data?
|
|
2 |
Step |
Understand the Given Data: |
The frequency table provides score ranges and the number of students who scored in each range. |
3 |
Step |
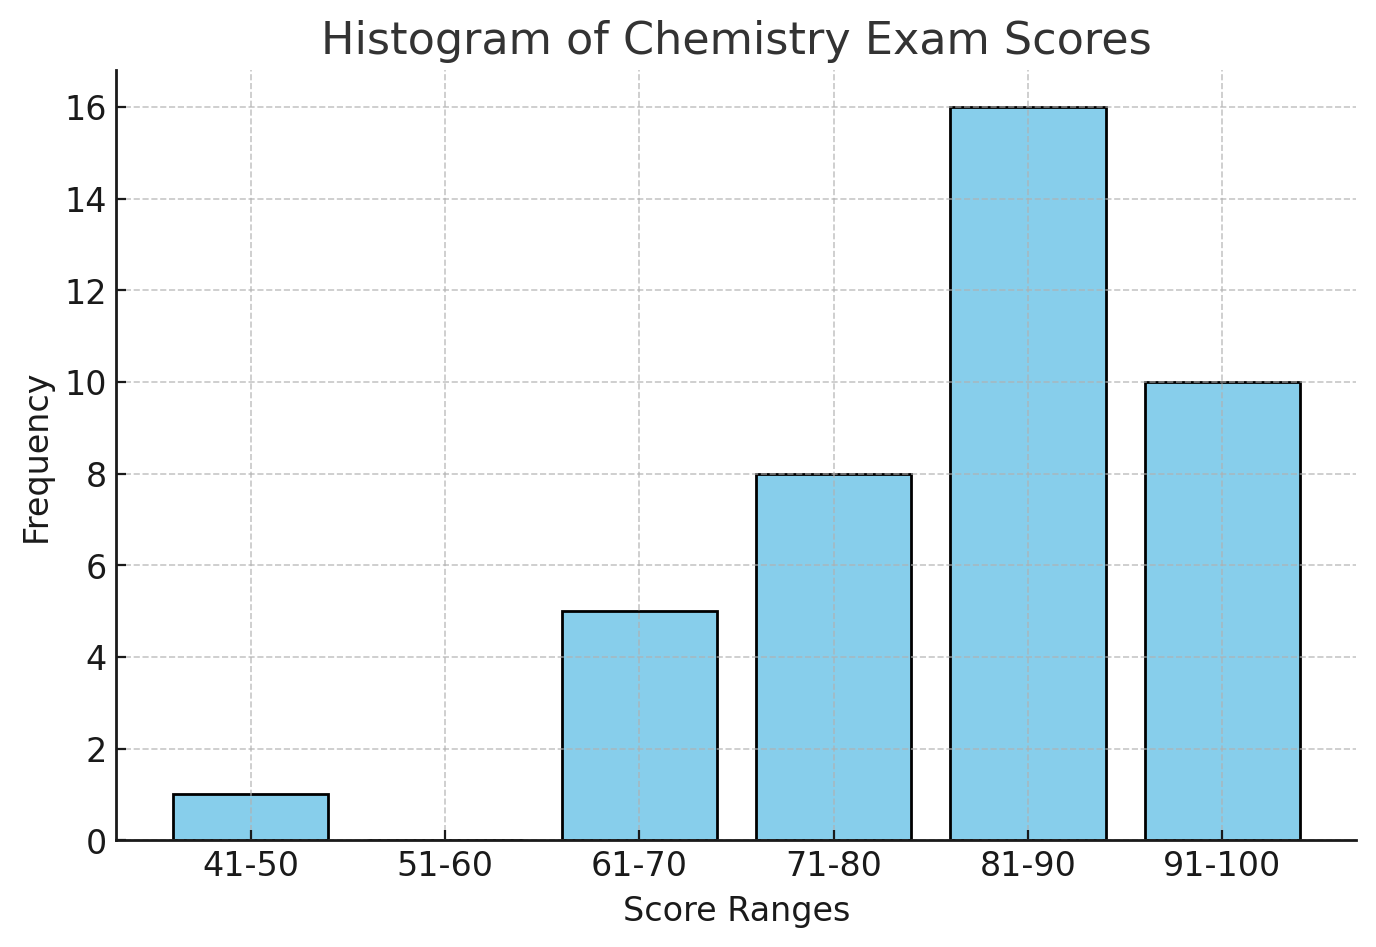
Create a Histogram: |
Each score range is represented on the x-axis. The frequency (number of students) is represented on the y-axis. Bars are drawn for each range with heights corresponding to the frequency.
|
4 |
Step |
Identify Key Characteristics of the Histogram: |
The highest frequency is 16 (in the 81-90 range), followed by 10 (in the 91-100 range). The lowest frequencies occur in the lower ranges (1 in 41-50 and 0 in 51-60). The frequency gradually increases from 61-70 to 81-90, then slightly decreases in the range of 91-100. There is a gap at 51-60, meaning no students scored in this range. |
5 |
Step |
Determine the Shape of the Distribution: |
Since the data has more values concentrated in the higher score ranges (81-100) and fewer in the lower ranges (41-60), the distribution is right-skewed (positively skewed). A right-skewed distribution means that most students performed well, with fewer low scores. |
6 |
Solution |
Option C (Right-skewed)is correct, as the data is concentrated in the higher ranges. |
|
7 |
Sumup |
Please summarize steps |
|
Choices |
|||
8 |
Choice-A |
This option is incorrect, because left-skewed distributions have more values in the lower ranges |
Wrong The distribution is left-skewed, with most students scoring in the lower ranges |
9 |
Choice-B |
This option is incorrect because a uniform distribution has similar frequencies across all ranges |
Wrong The distribution is uniform, with an equal number of students in each range |
10 |
Choice-C |
This option is correct, as the data is concentrated in the higher ranges |
Correct The distribution is right-skewed, with more students scoring in the higher ranges |
11 |
Choice-D |
This option is incorrect, because there are no two distinct peaks in frequency |
Wrong The distribution is bimodal, with two distinct peaks in frequency |
12 |
Answer |
Option |
C |
13 |
Sumup |
Please summarize choices |
|
Copyright © 2020-2024 saibook.us Contact: info@saibook.org Version: 4.0 Built: 04-Apr-2025 12:00PM EST