Lesson Topics Discussion Quiz: Class Homework |
Quiz Discussion |
Title: Visualizing Data |
Grade Lesson s6-l8 |
Explanation: Let us discuss a few questions on this topic and review the answers to every question. |
Quiz: Discussion
| Id | Name | Note |
|---|---|---|
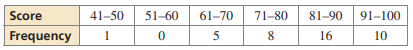
The frequency table shows the chemistry exam scores for a class. Create a histogram and describe the distribution. What best describes the data?
|
A) The distribution is left-skewed, with most students scoring in the lower ranges B) The distribution is uniform, with an equal number of students in each range C) The distribution is right-skewed, with more students scoring in the higher ranges D) The distribution is bimodal, with two distinct peaks in frequency |
|
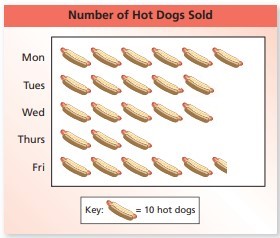
Which days sold the same number of hot dogs?
|
A) Monday and Tuesday B) Tuesday and Wednesday C) Thursday and Friday D) Monday and Wednesday |
|
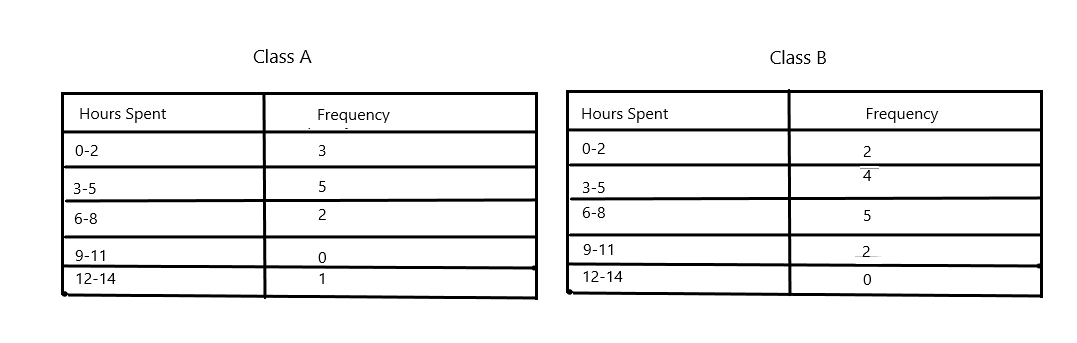
Which class has the highest number of students spending 6-8 hours on homework?
|
A) Class A B) Class B C) Both D) None |
|
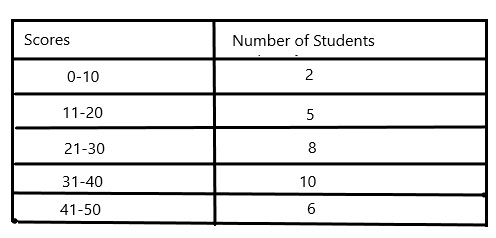
What is the total number of students who took the test?
|
A) 42 B) 40 C) 31 D) 35 |
|
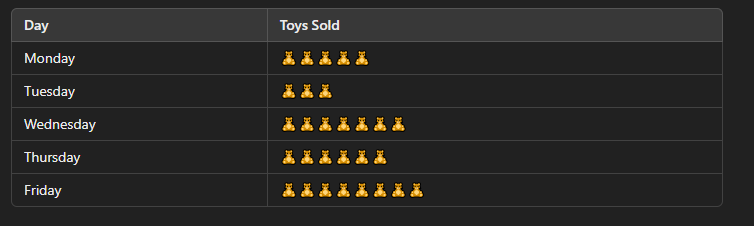
How many toys were sold on Wednesday?
|
A) 5 B) 9 C) 3 D) 7 |
Copyright © 2020-2024 saibook.us Contact: info@saibook.org Version: 4.0 Built: 04-Apr-2025 12:00PM EST