Lesson Topics Discussion Quiz: Class Homework |
Quiz At Home |
Title: Visualizing Data |
Grade Lesson s6-l8 |
Explanation: Hello Students, time to practice and review. Let us take next 10-15 minutes to solve the ten problems using the Quiz Sheet. Then submit the quiz to get the score. This is a good exercise to check your understanding of the concepts. |
Quiz: at Home
| Id | Name | Note |
|---|---|---|
1 |
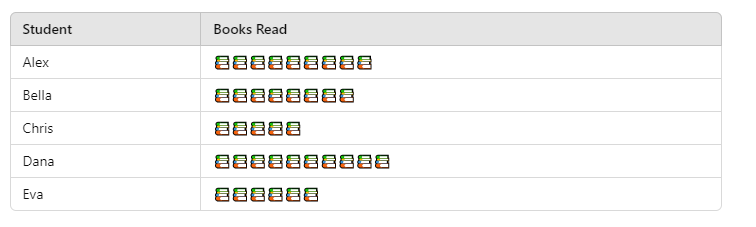
A pictograph shows the number of books read by students in a class over a month. Each symbol represents 2 books. What is the total number of books read by all students?
|
A) 70 books B) 38 books C) 80 books D) 81 books |
2 |
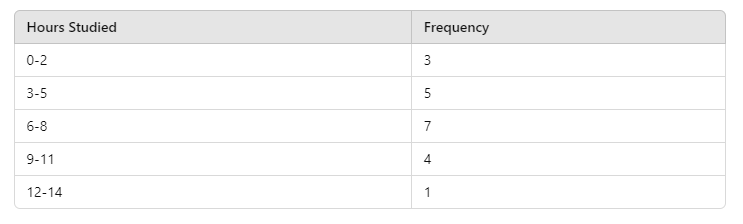
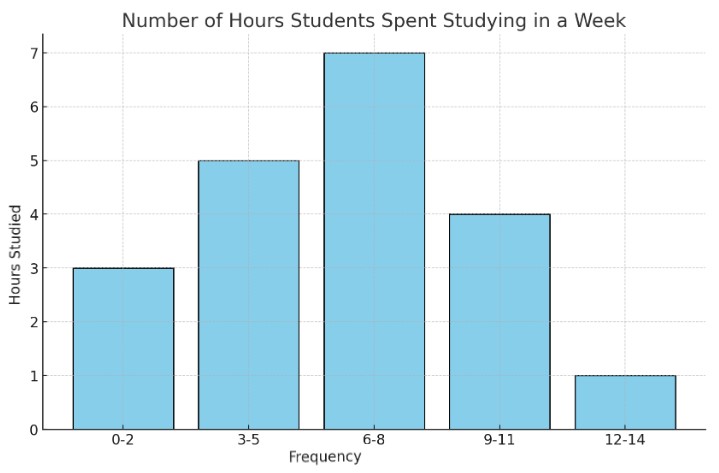
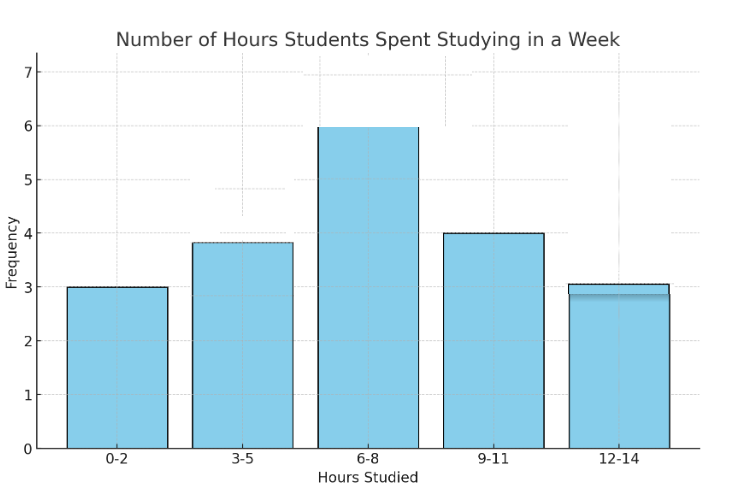
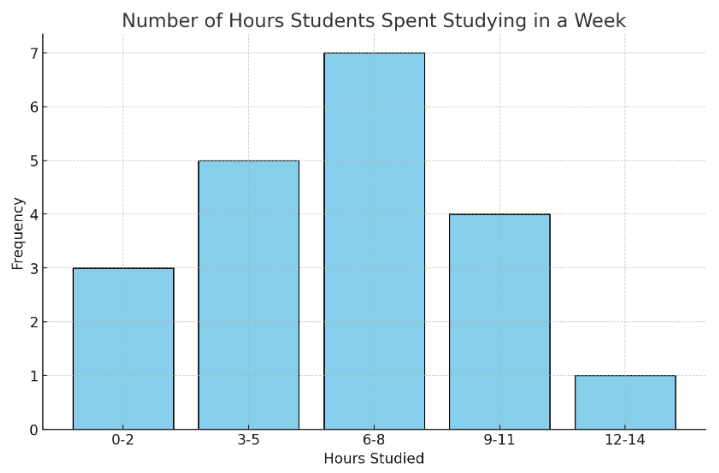
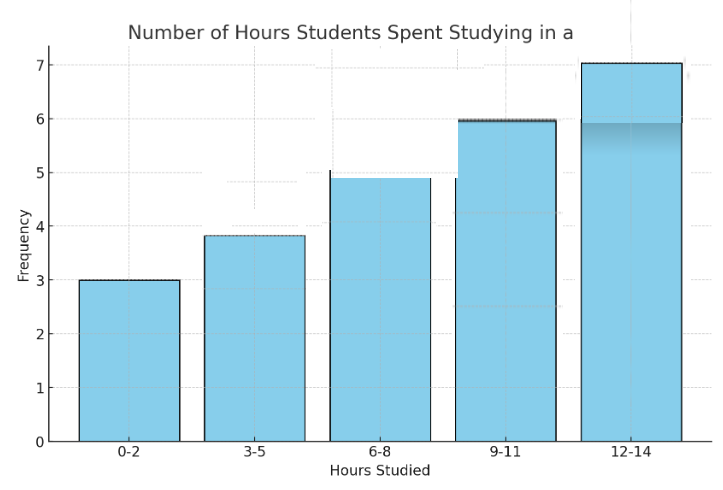
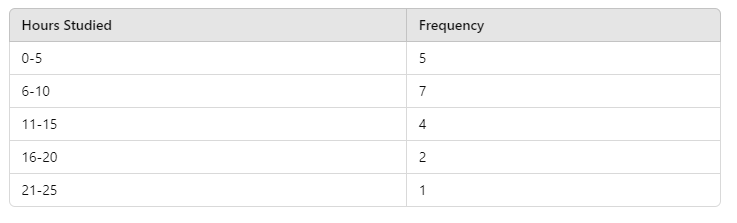
The number of hours students spent studying in a week is recorded as follows: Draw a histogram based on the data.
|
A) B) C) D) |
3 |
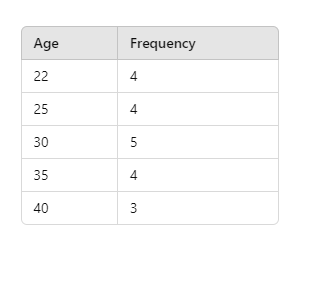
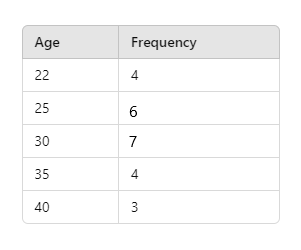
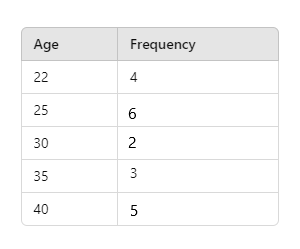
The following are the ages of participants in a local marathon: |
A) B) C) D) None of the above |
4 |
A histogram shows the number of hours students studied in a week:
|
A) 5 B) 4 C) 2 D) 3 |
5 |
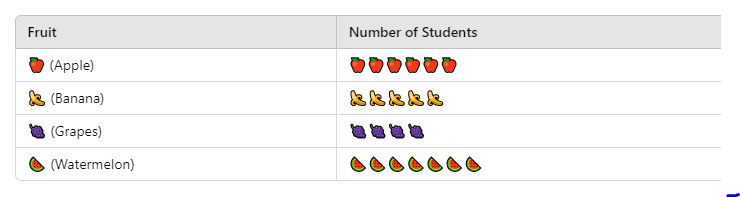
A class surveyed to find out the favorite fruit among students. The results are shown below in a pictograph where each symbol represents 2 students. How many more students prefer watermelon?
|
A) 3 B) 4 C) 7 D) 2 |
6 |
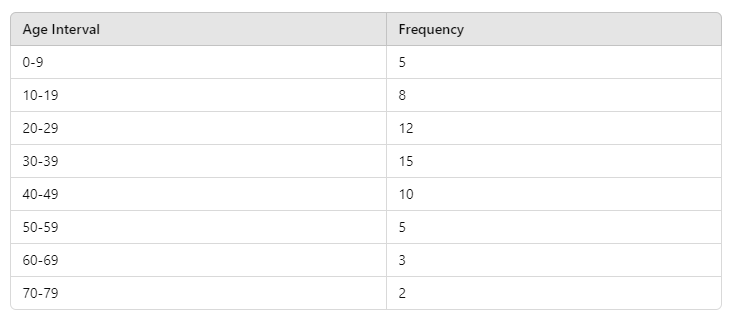
A survey was conducted to find out the ages of people attending a community event. The ages are grouped into intervals, and the data is displayed in a histogram. What is the total number of people surveyed?
|
A) 65 B) 55 C) 50 D) 60 |
7 |
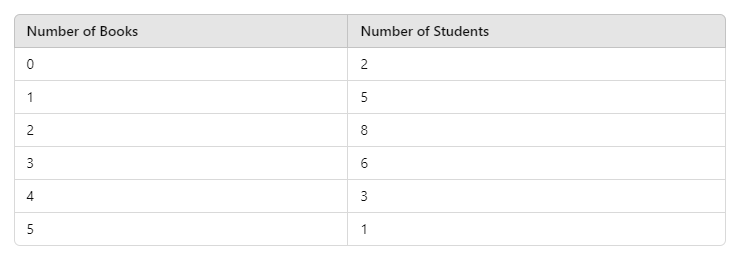
A teacher recorded the number of books read by students in a month. The data is shown below:
|
A) 6 B) 10 C) 8 D) 12 |
8 |
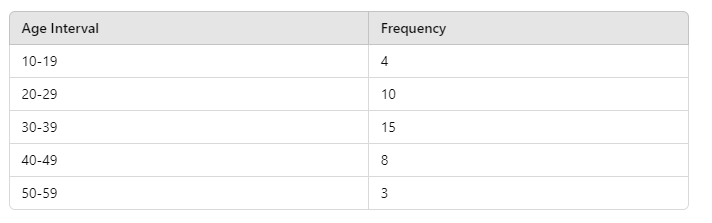
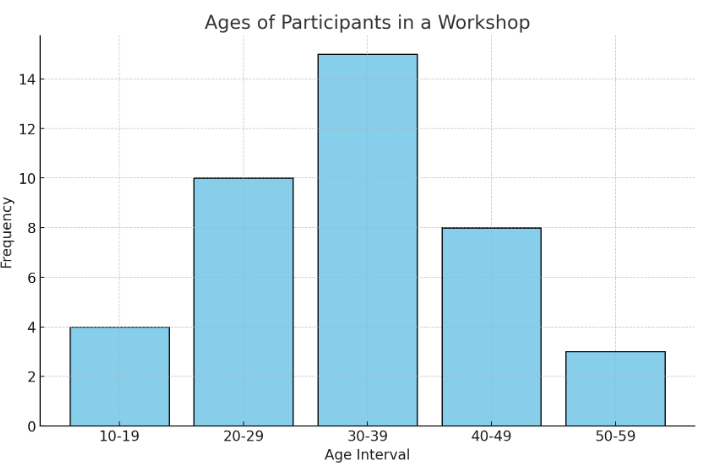
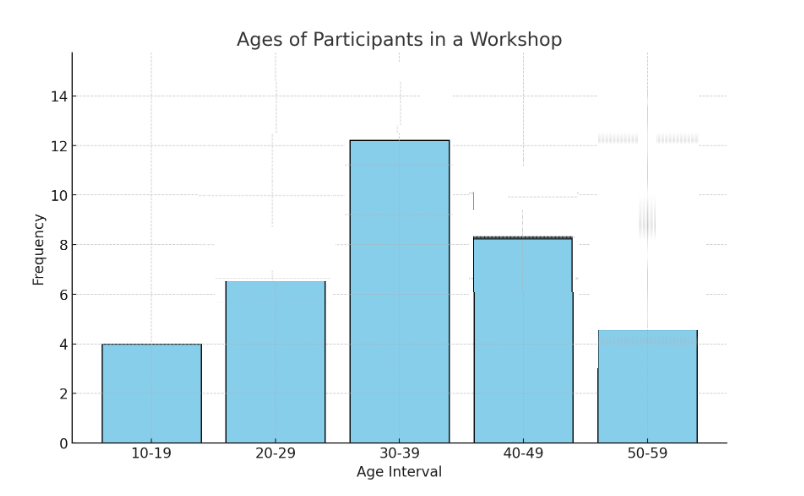
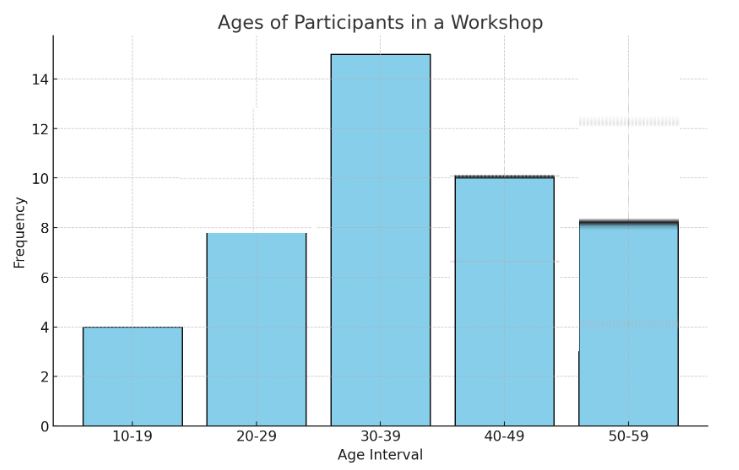
The ages of participants in a workshop are grouped into intervals and presented in a histogram. The data is as follows:
|
A) B) C) D) None of the above |
9 |
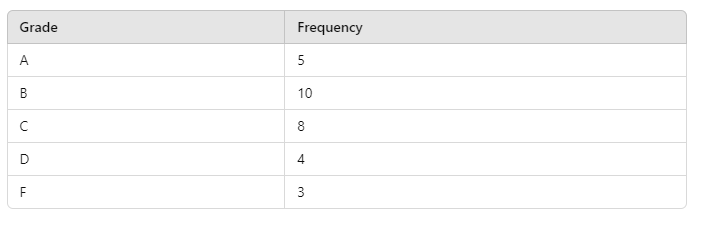
The following table shows the grades obtained by students in a math class:
|
A) 30% B) 32.05% C) 35.81% D) 33.33% |
10 |
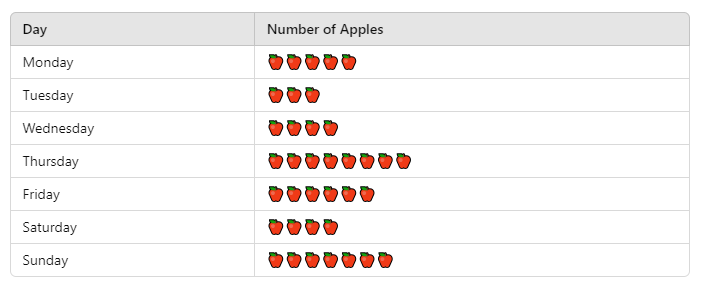
A pictograph shows the number of fruits consumed by a family in one week. The key indicates that one image of an apple represents 2 fruits. How many fruits were consumed in total during the week?
|
A) 35 B) 74 C) 37 D) 70 |
Copyright © 2020-2024 saibook.us Contact: info@saibook.org Version: 4.0 Built: 04-Apr-2025 12:00PM EST