Lesson Topics Discussion Quiz: Class Homework |
Quiz In Class |
Title: Visualizing Data |
Grade Lesson s6-l8 |
Explanation: Hello Students, time to practice and review. Let us take next 10-15 minutes to solve the ten problems using the Quiz Sheet. Then submit the quiz to get the score. This is a good exercise to check your understanding of the concepts. |
Quiz: in Class
| Id | Name | Note |
|---|---|---|
1 |
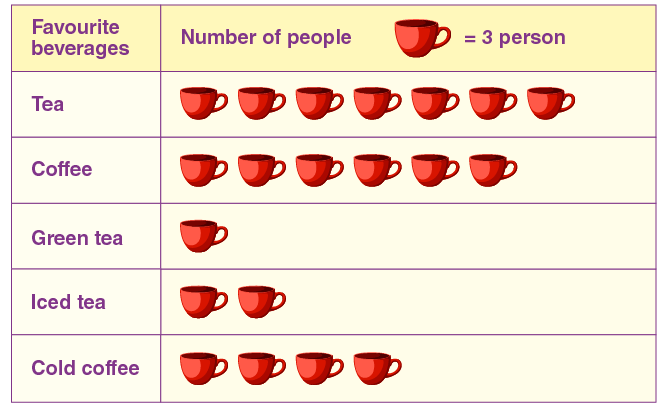
What is the total number of people who prefer beverages shown in the pictograph?
|
A) 16 B) 56 C) 62 D) 60 |
2 |
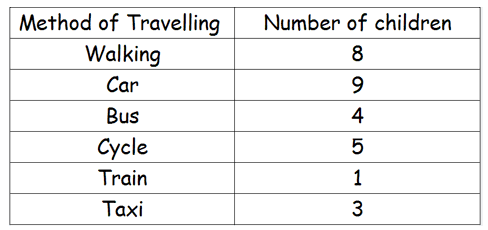
Which method of travelling is the least popular among children?
|
A) Car B) Train C) Cycle D) Bus |
3 |
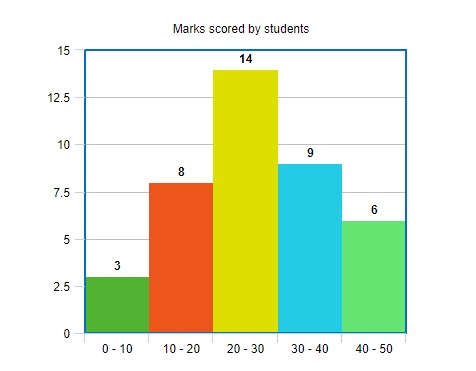
How many students scored more than 20 marks?
|
A) 32 students B) 25 students C) 29 students D) 28 students |
4 |
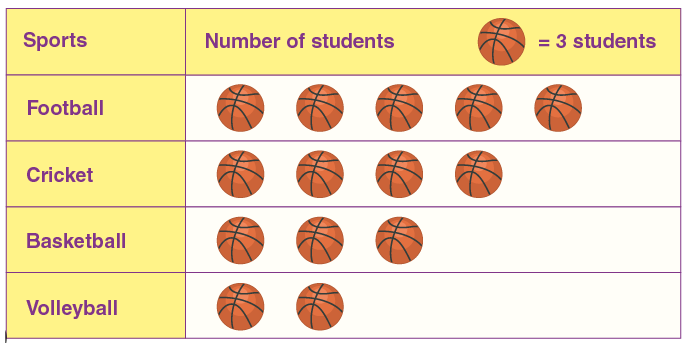
How many students like cricket shown in the pictograph?
|
A) 12 students B) 58 students C) 60 students D) 62 students |
5 |
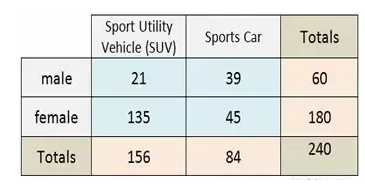
What percentage of the total surveyed population prefers sports cars?
|
A) 42% B) 35% C) 36% D) 44% |
6 |
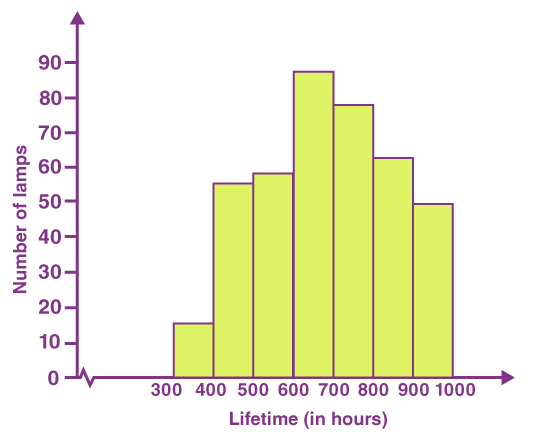
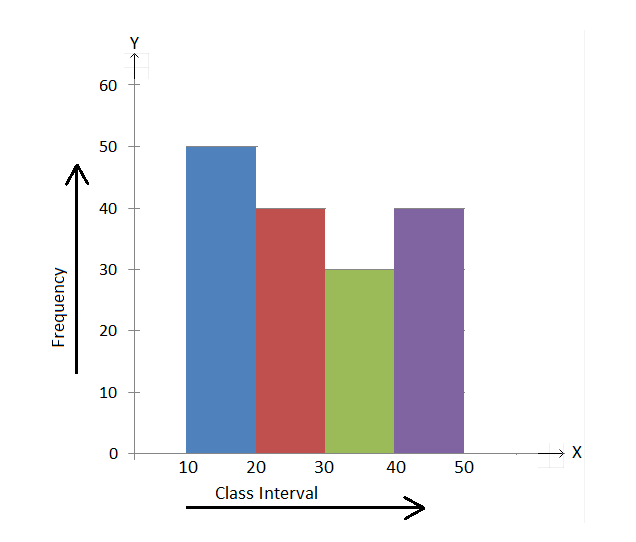
How many lamps have a lifespan of 600 to 700 hours?
|
A) 90 lamps B) 64 lamps C) 40 lamps D) 66 lamps |
7 |
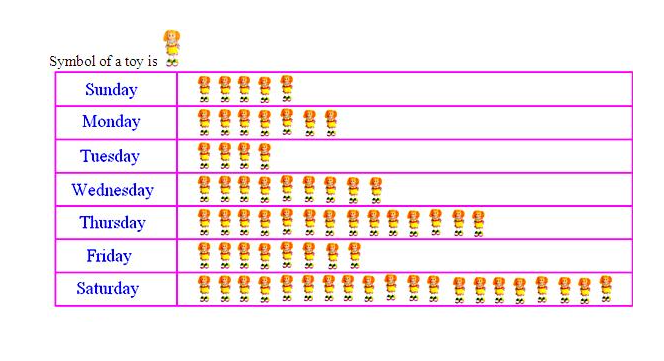
What is the total number of toy symbols for the entire week?
|
A) 48 toy symbols B) 44 toy symbols C) 46 toy symbols D) 67 toy symbols |
8 |
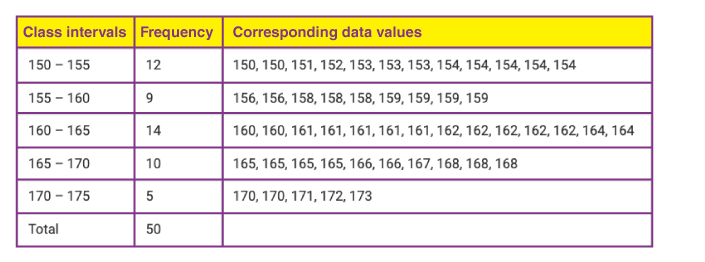
How many people are between 160 cm and 165 cm tall?
|
A) 18 B) 16 C) 14 D) 20 |
9 |
What is the range of the data?
|
A) 40 units B) 50 units C) 45 units D) 35 units |
10 |
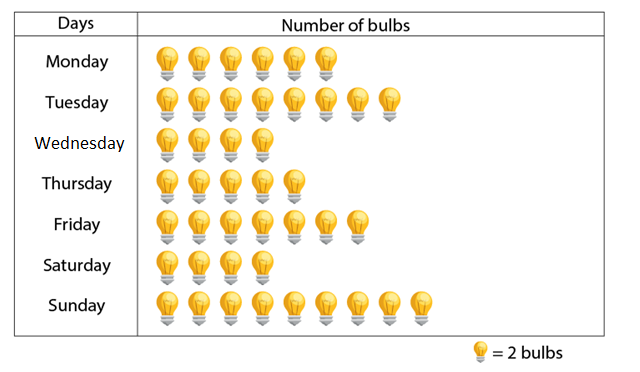
What is the total number of bulbs?
|
A) 83 B) 84 C) 85 D) 86 |
Copyright © 2020-2024 saibook.us Contact: info@saibook.org Version: 4.0 Built: 04-Apr-2025 12:00PM EST