Lesson Topics Discussion Quiz: Class Homework |
Example1 |
Title: Visualizing Data |
Grade Lesson s6-l8 |
Explanation: The best way to understand SAT-4 is by looking at some examples. Take turns and read each example for easy understanding. |
Examples
Topics → Definition Example1 Example2 Example3
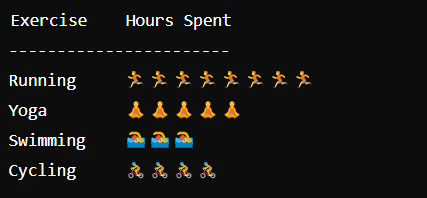
A person records the number of hours spent on different exercises in a week. The data is represented as follows:
Running: 15 hours
Yoga: 10 hours
Swimming: 5 hours
Cycling: 8 hours
Create a pictograph using a symbol where each symbol represents 2 hours.
Step: 1 |
|
Running, Yoga, Swimming, and Cycling Each symbol will represent 2 hours: Running - 8 hours Yoga - 5 hours Swimming - 3 hours Cycling - 4 hours |
|
Explanation: Here, we select a symbol to represent the quantity for each exercise and each symbol represents 2 hours. |
|
Step: 2 |
|
|
|
Explanation: Therefore, after allocating 2 hours to each activity, the total time will be 8 hours for running, 5 hours for Yoga, 3 hours for Swimming, and 4 hours for Cycling. |
|
Copyright © 2020-2024 saibook.us Contact: info@saibook.org Version: 4.0 Built: 04-Apr-2025 12:00PM EST