Lesson Topics Discussion Quiz: Class Homework |
Steps-3 |
Title: Two-Variable Data |
Grade Lesson s6-l2 |
Explanation: Hello Students, time to practice and review the steps for the problem. |
Quiz: Discussion Step
| Id | Type | Name | Note |
|---|---|---|---|
1 |
Problem |
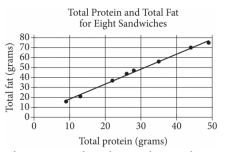
The scatterplot above shows the number of grams of both total protein and total fat for eight sandwiches on a restaurant menu. The line of best fit for the data is also shown. According to the line of best fit, which of the following is closest to the predicted increase in total fat, in grams, for every increase of 1 gram in total protein?
|
|
2 |
Step |
The predicted increase in total fat, in grams: |
Every increase of 1 gram in total protein is represented by the slope of the line of best fit |
3 |
Step |
Any two points on the line can be used to calculate the slope of the line as the change in the total protein. |
|
4 |
Step |
For instance, it can be estimated that the points (20, 34) and (30, 48) are on the line of best fit. |
|
5 |
Step |
\$"Slope of the line" = (Y2 - Y1) / (X2 - X1)\$ |
|
6 |
Step |
The slope of the line that passes through them is |
\$(48 - 34) / (30 - 20)\$ =\$(14) / (10)\$, or 1.4 |
7 |
Solution |
Therefore, by comparing the options given 1.5 is the closest to the slope of the line. |
|
8 |
Sumup |
Please summarize steps |
|
Choices |
|||
9 |
Choice-A |
The slope of the line of best fit is 2.5. This means that for every increase of 1 gram in total protein, the predicted increase in total fat is 2.5 grams |
Wrong 2.5 |
10 |
Choice-B |
This option suggests that the predicted increase in total fat for every increase of 1 gram in total protein is 2 grams. However, this value does not align with the slope of the line of best fit observed in the scatterplot |
Wrong 2 |
11 |
Choice-C |
This option suggests a predicted increase of 1.5 grams in total fat for every 1 gram increase in total protein. Based on the scatterplot and the slope of the line of best fit, this value appears to be the closest to the observed relationship between total protein and total fat |
Correct 1.5 |
12 |
Choice-D |
This option proposes a predicted increase in total fat of 1 gram for every increase of 1 gram in total protein. However, this contradicts the slope of the line of best fit, which indicates a different relationship between protein and fat content |
Wrong 1 |
13 |
Answer |
Option |
C |
14 |
Sumup |
Please summarize choices |
|
Copyright © 2020-2024 saibook.us Contact: info@saibook.org Version: 4.0 Built: 31-Mar-2025 12:00PM EST