Lesson Topics Discussion Quiz: Class Homework |
Quiz In Class |
Title: Two-Variable Data |
Grade Lesson s6-l2 |
Explanation: Hello Students, time to practice and review. Let us take next 10-15 minutes to solve the ten problems using the Quiz Sheet. Then submit the quiz to get the score. This is a good exercise to check your understanding of the concepts. |
Quiz: in Class
| Id | Name | Note |
|---|---|---|
1 |
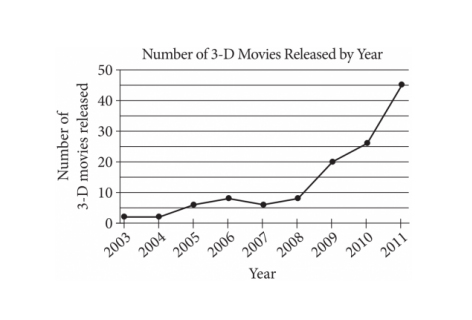
Based on the line graph above, which two consecutive years experienced the greatest change in the number of 3D movies released?
|
A) 2009 – 2010 B) 2008 – 2009 C) 2003 – 2004 D) 2010 – 2011 |
2 |
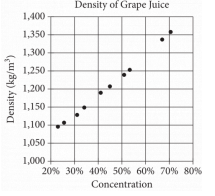
The scatterplot above displays the densities of various concentrations of grape juice. Based on the trend observed in the data, what is the predicted density, in kilograms per cubic meter (kg/m³), for grape juice with a concentration of 50%?
|
A) 1,350 B) 1,245 C) 1,300 D) 1,200 |
3 |
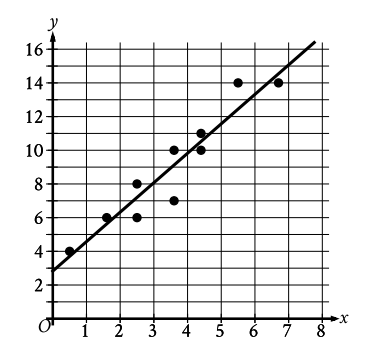
The scatterplot illustrates the relationship between two variables, x and y, with a line of best fit presented.
|
A) y = - 2.8 - 1.7x B) y = 2.8 - 1.7x C) y = 2 + 2x D) y = - 2.8 + 1.7x |
4 |
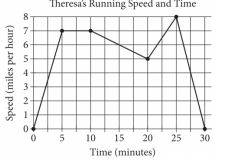
Theresa ran on a treadmill for thirty minutes, and her time and speed are shown on the graph above. According to the graph, which of the following statements is NOT true regarding Theresa’s run?
|
A) Theresa’s speed was increasing for a longer period than it was decreasing B) Theresa’s speed reached its maximum during the last ten minutes C) Theresa’s speed decreased at a constant rate during the last five minutes D) Theresa ran at a constant speed for five minutes |
5 |
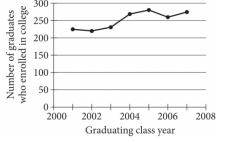
The line graph illustrates the number of graduates from the classes of 2001 to 2007 at a particular school who enrolled in college within 24 months after graduation. Among these graduating classes, which one had the fewest graduates who enrolled in college within that time frame?
|
A) 2004 B) 2002 C) 2005 D) 2007 |
6 |
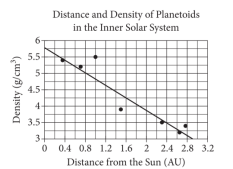
The scatterplot above illustrates the densities of seven planetoids, measured in grams per cubic centimeter, about their average distances from the Sun, expressed in astronomical units (AU). A line of best fit is also included in the diagram. An astronomer has discovered a new planetoid located approximately 1.2 AU from the Sun. Based on the line of best fit, which of the following options best approximates the density of this planetoid, measured in grams per cubic centimeter?
|
A) 4.6 B) 4.1 C) 3.6 D) 5.5 |
7 |
Using the following data, create a scatterplot: Hours studied (x-axis): 2, 4, 6, 8, and 10. Test scores (y-axis): 70, 75, 80, 85, and 90. What type of relationship does the scatterplot suggest? |
A) A positive nonlinear relationship B) A negative linear relationship C) A no correlation D) A positive linear relationship |
8 |
Based on the line of best fit, represented by the equation ( y = 2x + 10 ), which describes the relationship between the number of hours exercised per week (x) and the number of calories burned (y), how many calories would be burned if a person exercises for 5 hours per week? |
A) 25 calories B) 15 calories C) 20 calories D) 30 calories |
9 |
In a scatterplot that displays the relationship between the number of days absent from school (x-axis) and test scores (y-axis), one point is noticeably far from the others. This point is referred to as an outlier. An outlier can significantly impact data analysis by skewing the results, potentially leading to misleading conclusions about the overall relationship between the two variables. |
A) Anomaly; It can distort the line of best fit, influence correlation, impact statistical measures, and potentially lead to misinterpretation of the data B) An outlier is a point far away from others in a scatterplot, and it can distort the correlation, line of best fit, and summary statistics, leading to inaccurate data analysis. C) Extrapolation point; It can affect the accuracy of predictions made based on the scatterplot D) Deviation; It can introduce variability into the data analysis, affecting the reliability of conclusions drawn from the scatterplot |
10 |
A scatter plot illustrates the relationship between the age of a car (x) and its resale value (y). If the line of best fit passes through the point (5, 8000), what would the resale value of a 5-year-old car be according to that line of best fit? |
A) $7,000 B) $9,000 C) $6,000 D) $8,000 |
Copyright © 2020-2024 saibook.us Contact: info@saibook.org Version: 4.0 Built: 31-Mar-2025 12:00PM EST