Lesson Topics Discussion Quiz: Class Homework |
Steps-2 |
Title: Two-Variable Data |
Grade Lesson s6-l2 |
Explanation: Hello Students, time to practice and review the steps for the problem. |
Quiz: Discussion Step
| Id | Type | Name | Note |
|---|---|---|---|
1 |
Problem |
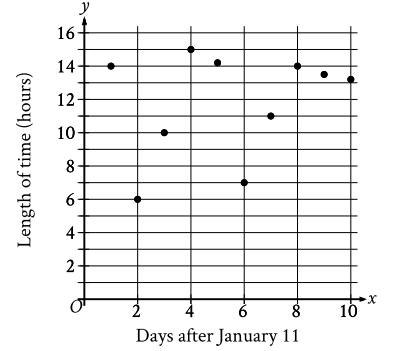
The scatterplot shows the relationship between the length of time y, in hours, a certain bird spent in flight and the number of days after January 11, x. What is the average rate of change, in hours per day, of the length of time the bird spent in flight on January 13 to the length of time the bird spent in flight on January 15?
|
|
2 |
Step |
It’s given that the scatterplot shows the relationship between the length of time is |
y, in hours |
3 |
Step |
A certain bird spent in flight and the number of days after January 11 |
x |
4 |
Step |
Since January 13 is 2 days after January 11, it follows that January 13 corresponds to an x-value of 2 in the scatterplot In the scatterplot, when x = 2, the corresponding value of y = 6. |
|
5 |
Step |
In other words, on January 13 |
→ The bird spent 6 hours in flight |
6 |
Step |
Since January 15 is 4 days after January 11, it follows that January 15 corresponds to an x-value of 4 in the scatterplot In the scatterplot, when x = 4, the corresponding value of y = 15. |
|
7 |
Step |
In other words, on January 15 |
→ The bird spent 15 hours in flight |
8 |
Step |
Therefore, the average rate of change, in hours per day, of the length of the time the bird spent in flight on January 13 to the length of time the bird spent in flight on January 15 is |
The difference in the length of time, in hours, the bird spent in flight divided by the difference in the number of days after January 11, or \$(15 - 6)/(4 - 2)\$, which is equivalent to \$9/2\$ |
9 |
Sumup |
Please summarize steps |
|
Choices |
|||
10 |
Choice-A |
This option is correct. It represents the average rate of change in hours per day of the length of time the bird spent in flight from January 13 to January 15 |
Correct \$9/2\$ |
11 |
Choice-B |
This option is incorrect. It does not accurately represent the average rate of change in hours per day for the given period |
Wrong \$(11)/2\$ |
12 |
Choice-C |
Option C represents an average rate of change of \$7/2\$ hours per day. Again, this does not match the average rate of change observed in the scatterplot, which is \$9/2\$ hours per day. Thus, option C is not correct |
Wrong \$7/2\$ |
13 |
Choice-D |
This option indicates an average rate of change of \$(13)/2\$ hours per day. However, this rate is higher than the correct rate of change observed in the scatterplot. It suggests a faster increase in flight time over the two-day period, which contradicts the data |
Wrong \$(13)/2\$ |
14 |
Answer |
Option |
A |
15 |
Sumup |
Please summarize choices |
|
Copyright © 2020-2024 saibook.us Contact: info@saibook.org Version: 4.0 Built: 31-Mar-2025 12:00PM EST