Lesson Example Discussion Quiz: Class Homework |
Quiz At Home |
Title: Venn Diagrams, Circle graphs, Bar and Line Graphs |
Grade: 1300-a Lesson: S4-L7 |
Explanation: Hello Students, time to practice and review. Let us take next 10-15 minutes to solve the ten problems using the Quiz Sheet. Then submit the quiz to get the score. This is a good exercise to check your understanding of the concepts. |
Quiz: at Home
| Problem Id | Problem | Options |
|---|---|---|
1 |
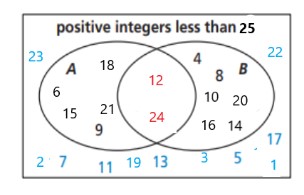
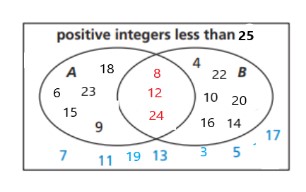
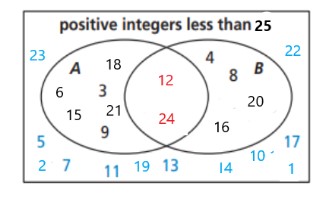
Use the Venn diagrams you drew in Exercises 1–3 to decide whether the statement is true or false. Explain you reasoning. There are 2 positive integers less than 25 that are both a multiple of 3 and a multiple of 4. |
A) TRUE B) False C) None of this D) Both |
2 |
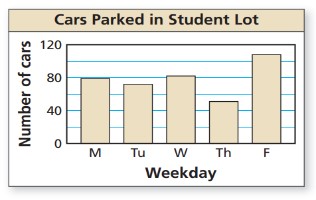
Use the bar graph to answer each question. About how many more cars were parked in the student lot on Friday than on Monday?
|
A) 28 B) 30 C) 25 D) 32 |
3 |
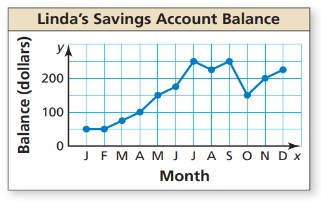
Use the line graph to answer each question. In which month(s) was Linda’s account balance $250?
|
A) July and August B) May and October C) July and September D) April and December |
4 |
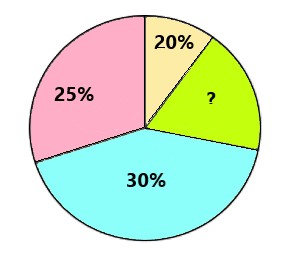
A circle graph represents the expenditure of a family in a month. The known expenditures are: Rent: 30%
|
A) 33% B) 30% C) 27% D) 25% |
5 |
In a survey of 150 people, it was found that: 90 people like tea. |
A) 48 people like only tea, 35 like only coffee, and 20 like only juice. B) 63 people like only tea, 31 like only coffee, and 11 like only juice. C) 54 people like only tea, 28 like only coffee, and 25 like only juice. D) 50 people like only tea, 25 like only coffee, and 15 like only juice. |
6 |
A pie chart is divided into sections representing different types of fruits sold in a market. The sections are: Apples: 90° |
A) Apples: 24.8% B) Apples: 23% C) Apples: 25% D) Apples: 25% |
7 |
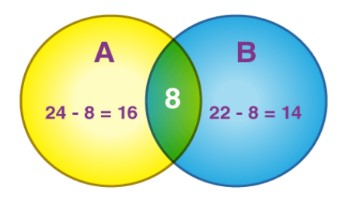
If A and B are two sets such that number of elements in A is 24, number of elements in B is 22 and number of elements in both A and B is 8, find: n(A ∪ B).
|
A) 40 B) 38 C) 45 D) 34 |
8 |
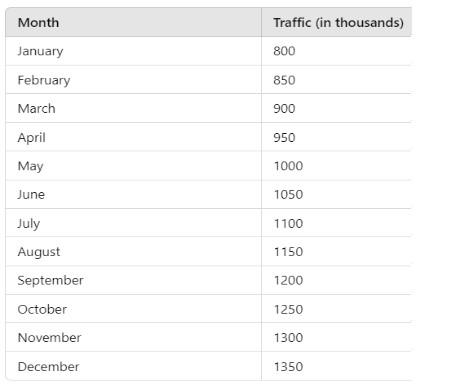
A line graph shows the monthly website traffic for a company’s online store over the past year:
|
A) 1400 thousand B) 1450 thousand C) 1300 thousand D) 1350 thousand |
9 |
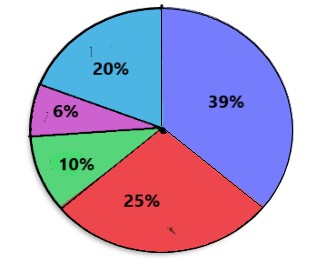
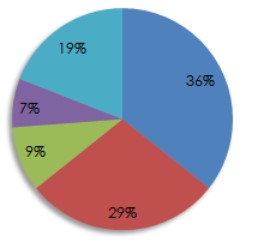
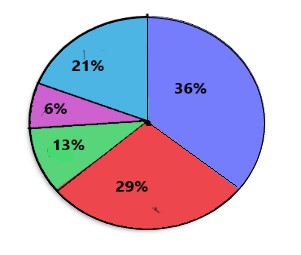
A fruit basket is filled with 36% Apples, 29% Bananas, 9% Mangoes, 7% Pineapples and 19% Grapes. Prepare a circle graph chart as per the data provided. |
A) B) C) D) None of this |
10 |
Draw a Venn diagram of the sets described Of the positive integers less than 25, set A consists of the multiples of 3 and set Bconsists of the multiplies of 4. |
A) B) C) D) None of this |
Copyright © 2020-2022 saibook.us Contact: info@saibook.us Version: 1.5 Built: 18-June-2024 09:20AM EST