Lesson Example Discussion Quiz: Class Homework |
Quiz Discussion |
Title: Venn Diagrams, Circle graphs, Bar and Line Graphs |
Grade: 1300-a Lesson: S4-L7 |
Explanation: Let us discuss a few questions on this topic and review the answers to every question. |
Quiz: Discussion in Class
| Problem Id | Problem | Options |
|---|---|---|
Steps 1 |
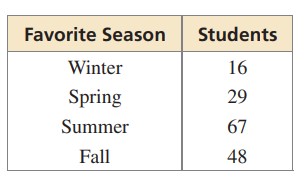
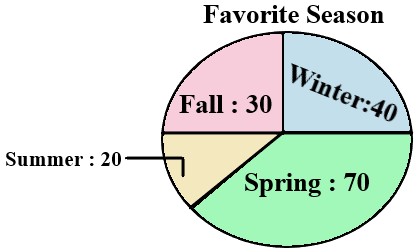
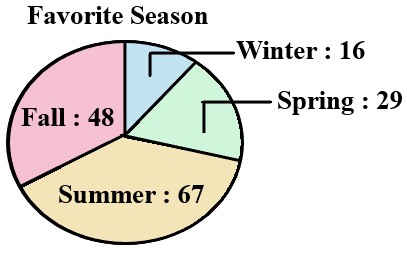
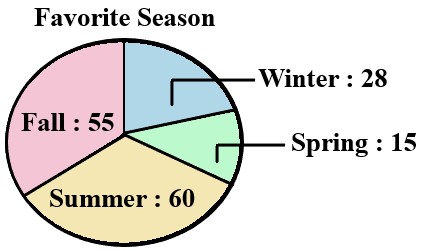
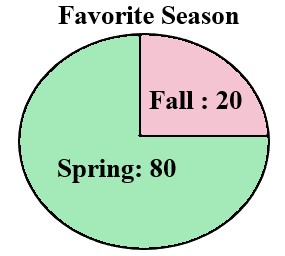
The table shows the results of a survey. Display the data in a circle graph.
|
A) B) C) D) |
Steps 2 |
Use the Venn diagrams you drew in Exercises 1 – 3 to decide whether the statement is true or false. Explain your reasoning. The only positive factors of 12 less than 13 that are not even are 1 and 3. |
A) FALSE B) Both C) TRUE D) None of this |
Steps 3 |
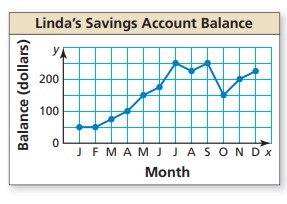
Use the line graph to answer each question. In which month(s) was Linda’s account balance $150?
|
A) January and May B) June and July C) October and December D) May and October |
Steps 4 |
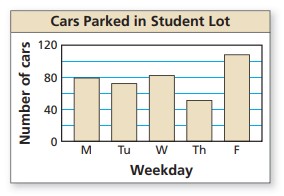
Use the bar graph to answer each question. On which day of the week were the greatest number of cars parked in the student lot?
|
A) Friday B) Monday C) Sunday D) Tuesday |
Steps 5 |
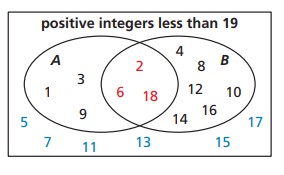
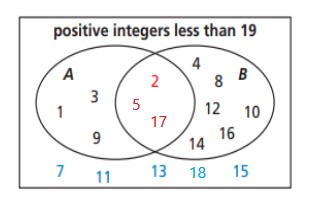
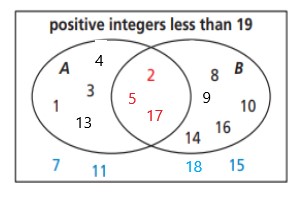
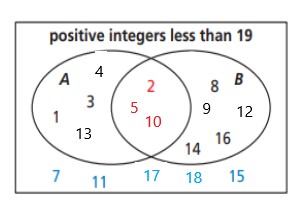
Draw a Venn diagram of the positive integers less than 19, where set A consists of factors of 18 and set B consists of even numbers. |
A) B) C) D) |
Copyright © 2020-2022 saibook.us Contact: info@saibook.us Version: 1.5 Built: 18-June-2024 09:20AM EST