Lesson Example Discussion Quiz: Class Homework |
Quiz At Home |
Title: Box and Whisker Plots, Identifying Outliers |
Grade: 1300-a Lesson: S4-L6 |
Explanation: Hello Students, time to practice and review. Let us take next 10-15 minutes to solve the ten problems using the Quiz Sheet. Then submit the quiz to get the score. This is a good exercise to check your understanding of the concepts. |
Quiz: at Home
| Problem Id | Problem | Options |
|---|---|---|
1 |
Determine the outliers in this set of marathon finish times (in minutes): |
A) Outlier: 130 B) Outlier: 300 C) Outlier: 180 D) Outlier: 135 |
2 |
Make a box-and-whisker plot that represents the data. Describe the distribution. |
A) Symmetric B) Skewed Left C) Skewed Right D) None of this |
3 |
The heights (in centimeters) of a group of people are as follows: 148, 150, 152, 155, 157, 160, 162, 165, 168, 170, 173, 175, 178, 180, 183, 185, 188, 190, 193, 195, 198, 200, 203, 205, and 210. Determine the interquartile range (IQR). |
A) 29.8 B) 31.3 C) 28.6 D) 30.5 |
4 |
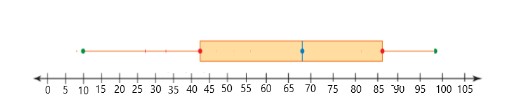
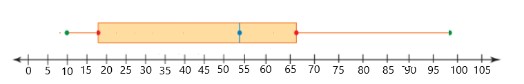
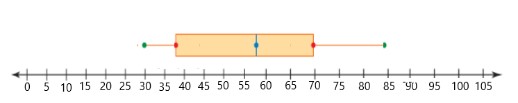
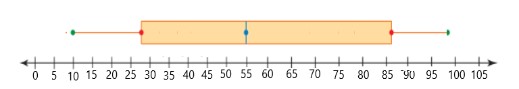
The test scores of 25 students in a class are as follows: 15, 28, 40, 72, 34, 55, 76, 27, 88, 99, 80, 21, 12, 93, 44, 35, 86, 77, 28, 89, 10, 31, 92, 84, and 96. Construct a box and whisker plot for the given data set. |
A) B) C) D) |
5 |
The daily production output (in units) of a manufacturing plant over 30 days is: 200, 210, 215, 220, 225, 230, 235, 240, 245, 250, 255, 260, 265, 270, 275, 280, 285, 290, 295, 300, 305, 310, 315, 320, 325, 330, 335, 340, 345, 350, and 450. Use the \$1.5 times "IQR"\$ rule to identify any outliers in the dataset. |
A) Outliers = 200 B) Outliers = 350 C) Outliers = 450 D) Outliers = 210 |
6 |
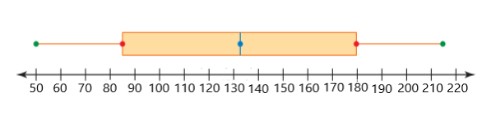
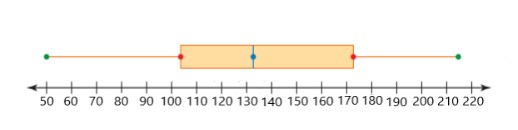
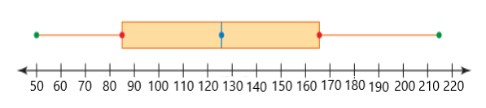
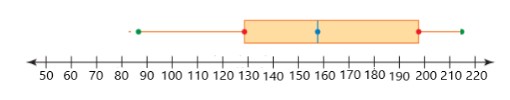
The monthly internet usage (in GB) of 35 households in a neighborhood are as follows: 50, 55, 60, 65, 70, 75, 80, 85, 90, 95, 100, 105, 110, 115, 120, 125, 130, 135, 140, 145, 150, 155, 160, 165, 170, 175, 180, 185, 190, 195, 200, 205, 210, and 215. Draw a box and whisker plot representing the internet usage distribution. |
A) B) C) D) |
7 |
Data Set 2: 102, 105, 108, 110, 115, 120, 122, 125, 128, 130, 135, 140, 142, 145, 150, 155, 160, 162, 165, 170, and 200. Calculate the first quartile (Q1), third quartile (Q3), and interquartile range (IQR) for the data set. |
A) First Quartile (Q1): 117.5 B) First Quartile (Q1): 116.1 C) First Quartile (Q1): 115 D) First Quartile (Q1): 117.5 |
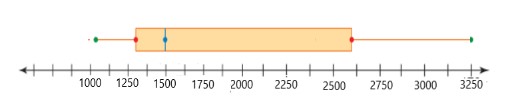
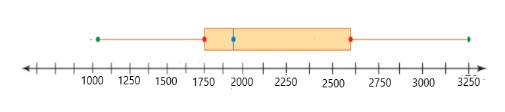
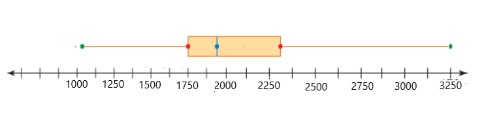
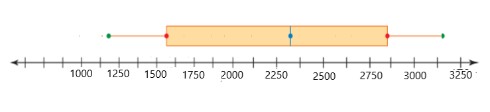
8 |
The heights (in cm) of a group of students are as follows: 1160, 1262, 2365, 1568, 1270, 1472, 1775, 1278, 1480, 1220, 2185, 1087, 2590, 1392, 2695, 1498, 2200, 3203, 2205, 1008, 2410, 1312, 3215, 2618, and 3250. Construct a box and whisker plot for the given data set. |
A) B) C) D) |
9 |
Researcher records the weights (in kg) of a sample of 20 cats. Weights: 22.5, 33.1, 43.2, 33.5, 53.6, 73.8, 24.0, 14.1, 54.2, 44.5, 84.7, 35.0, 65.2, 35.5, 125.8, 16.0, 66.2, 56.5, 137.0, and 150.0. Identify any outliers in the data set. |
A) outliers = 14.1 B) outliers = 150.0 C) outliers = 137.0 D) outliers = 22.5 |
10 |
Data Set 2: 102, 105, 108, 110, 115, 120, 122, 125, 128, 130, 135, 140, 142, 145, 150, 155, 160, 162, 165, 170, and 200. Calculate the first quartile (Q1), third quartile (Q3), and interquartile range (IQR) for the data set. Determine the lower and upper bounds for identifying outliers using the \$1.5 times IQR\$ rule. |
A) Lower Bound: 697.5 B) Lower Bound: 617.5 C) Lower Bound: 637.1 D) Lower Bound: 687.5 |
Copyright © 2020-2022 saibook.us Contact: info@saibook.us Version: 1.5 Built: 18-June-2024 09:20AM EST