Lesson Example Discussion Quiz: Class Homework |
Example |
Title: Box and Whisker Plots, Identifying Outliers |
Grade: 1300-a Lesson: S4-L6 |
Explanation: The best way to understand SAT-2 is by looking at some examples. Take turns and read each example for easy understanding. |
Examples:
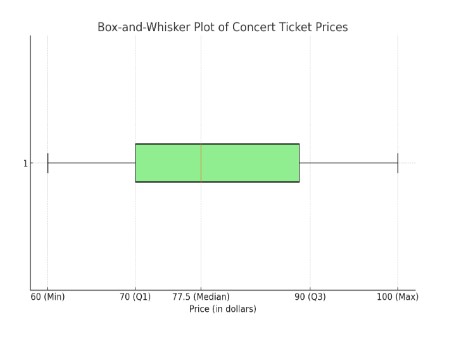
A group of friends recorded the prices (in dollars) they paid for concert tickets.
Make a box-and-whisker plot that represents the data. Describe the distribution:
75, 60, 80, 90, 65, 70, 85, 95, 70, and 100.
Step 1a
|
|
60, 65, 70, 70, 75, 80, 85, 90, 95, and 100 The median of the lower half of the data. The median of the entire data set. The median of the upper half of the data. |
|
Explanation: Here, we define the smallest number as the minimum and the largest number as the maximum. Then, we calculate the median values for the lower half, upper half, and the entire dataset. |
|
Step 1b
|
|
The box-and-whisker plot of concert ticket prices shows the following characteristics: Minimum Value: The lowest price is $60. First Quartile (Q1): 25% of the prices are below $70. Median (Q2): The median price is $77.5, indicating that 50% of the prices are
below this value. Third Quartile (Q3): 75% of the prices are below $90. Maximum Value: The highest price is $100. |
|
Explanation: Here, we write all the values. |
|
Step 1c
|
|
The interquartile range (IQR) is the difference between Q3 and Q1, which is 90 − 70 = 20. This indicates the middle 50% of the data span a range of $20. The data appears to be roughly symmetric, as the median is centered between the first and third quartiles and the whiskers extend relatively equally on both sides. Most of the concert ticket prices cluster around the median ($77.5), with the range extending from $60 to $100 without any extreme outliers. Overall, the distribution shows that concert ticket prices in this dataset tend to cluster around $77.5, with a fairly symmetric distribution from $60 to $100. |
|
Explanation: Therefore, the given set is a Symmetric distribution. |
|
Applying the IQR Method to Identify Outliers in Concert Ticket Prices.
Concert ticket prices: 75, 60, 80, 90, 65, 70, 85, 95, 70, and 100
Step 2a
|
|
75, 60, 80, 90, 65, 70, 85, 95, 70, and 100 Q1 (First Quartile) = 70 \$"Lower Bound" = "Q"1 − 1.5 \times "IQR"\$ \$"Upper Bound" = "Q"3 + 1.5 \times "IQR"\$ |
|
Explanation: Here, we find Lower bound and Upper bound and IQR. |
|
Step 2b
|
|
Any data point below 40 or above 120 is considered an outlier. In this dataset, all data points are within the bounds of 40 and 120. |
|
Explanation: Here, we identify outliers. There are no outliers in the given data. |
|
Copyright © 2020-2022 saibook.us Contact: info@saibook.us Version: 1.5 Built: 18-June-2024 09:20AM EST