Lesson Example Discussion Quiz: Class Homework |
Lesson |
Title: Box and Whisker Plots, Identifying Outliers |
Grade: 1300-a Lesson: S4-L6 |
Explanation: Hello students, let us learn a new topic in SAT-2 today with definitions, concepts, examples, and worksheets included. |
Lesson:
Definition: Box and Whisker Plots |
|
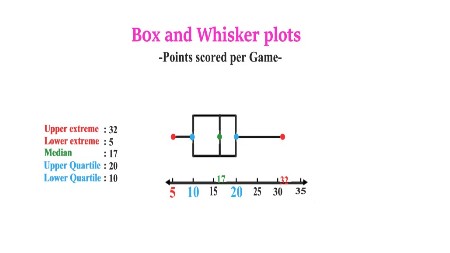
A box-and-whisker plot shows a data set on a number line using the lowest value, the highest value, and the quartiles of the data. The five numbers that create the box-and-whisker plot are known as the five-number summary of the data set. |
. |
Explanation: The provided image is the Upper extreme, Lower extreme, Median, Upper quartile, and Lower quartile in Game. |
|
Definition: Identifying Outliers |
|
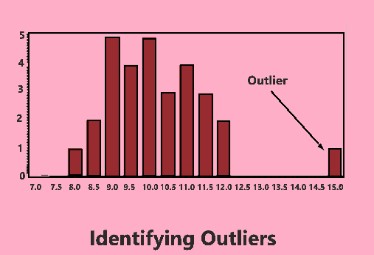
Identifying outliers means finding data points in a dataset that are very different from the rest. These unusual points stand out because they are much higher or lower than most of the other data. Finding outliers helps in understanding unusual patterns, errors, or unique occurrences in the data. |
. |
Explanation: The chart shows the distribution of recreational boating accidents, with "Outlier" indicating data points outside the expected distribution. |
|
Copyright © 2020-2022 saibook.us Contact: info@saibook.us Version: 1.5 Built: 18-June-2024 09:20AM EST