Lesson

Title: Normal distribution

Grade: 9-a Lesson: S4-L9

Explanation: Hello students, let us learn a new topic in statistics today with definitions, concepts, examples, and worksheets included.

Lesson:

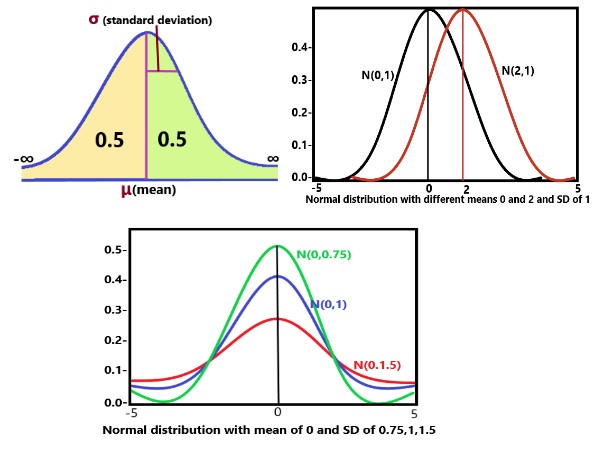
Definition: Normal distribution:

  • The discovery of the normal distribution is credited to Carl Gauss. It is also known as the bell curve or Gaussian distribution.

  • This is the most commonly used distribution in statistics because it closely approximates the distributions of many different measurements.

  • Height, birth weight, reading ability, job satisfaction, or SAT scores are just a few examples.

1

Explanation:

Properties of normal distribution:

  • It is continuous.

  • Symmetric about the mean μ.

  • It is bell-shaped or mound-shaped.

  • Mean = median = mode = μ .

  • The curve approaches the horizontal axis on both sides of the mean without ever touching or crossing it.

  • Nearly all of the distribution (99.73 percent) lies within three standard deviations of the mean.

  • It has two inflection points : one at \$x = \mu + \sigma \$ and one at \$x = \mu - \sigma \$

  • The normal distribution is fully determined by two parameters, namely, mean and variance.

  • The location of the distribution on the number line depends on the mean of the distribution. (See image1)

  • The shape of the distribution depends on the standard deviation. A normal distribution with a larger standard deviation is more spread out, while one with a smaller standard deviation is more tightly bunched.(See image2)

  • The X-axis is the symptote to the curve.

  • If X∼N(\$\mu_1,\sigma_1^2\$) and Y∼N(\$\mu_2,\sigma_2^2\$) and X and Y are independent, then X+Y∼N(\$\mu_1 + \mu_2,\sigma_1^2 + \sigma_2^2\$)

Definition: Standard normal distribution:

  • The standard normal distribution, also called the z-distribution, is a special normal distribution where the mean is 0 and the standard deviation is 1.

Every normal distribution is a version of the standard normal distribution that’s been stretched or squeezed and moved horizontally right or left.

\$Z = (X-\mu )/ \sigma\$

X is random variable,

\$\mu\$ = Mean ,

\$\sigma\$ = standard deviation

Notation: X∼N(μ,σ)

2

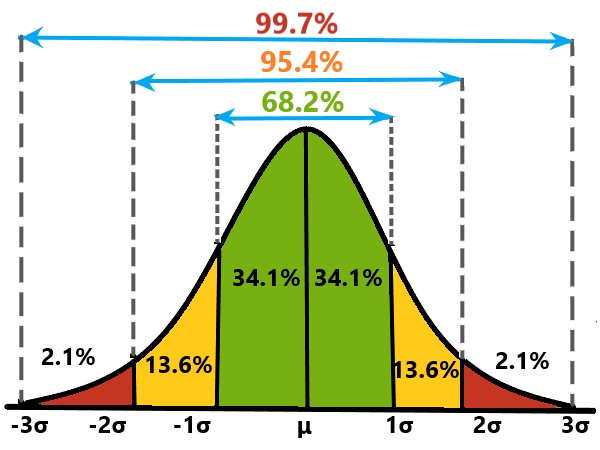
Explanation:

Empirical rule:

  • Approximately 68 percent of the area under the curve lies between μ - σ and μ + σ.

  • Approximately 95 percent of the area under the curve lies between μ + 2σ and μ + 2σ.

  • Approximately 99.7 percent of the area under the curve lies between μ + 3σ and μ + 3σ.
    or

  • Around 68% of values are within 1 standard deviation from the mean

  • Around 95% of values are within 2 standard deviations from the mean.

  • Around 99.7% of values are within 3 standard deviations from the mean.


Copyright © 2020-2022 saibook.us Contact: info@saibook.us Version: 1.5 Built: 27-February-2023 06:00 AM EST