Lesson Example Discussion Quiz: Class Homework |
Example |
Title: Normal distribution |
Grade: 9-a Lesson: S4-L9 |
Explanation: The best way to understand statistics is by looking at some examples. Take turns and read each example for easy understanding. |
Examples:
Students of a class were given an aptitude test. Their marks were found to be normally distributed with mean 60 and standard deviation 5. What percentage of students scored
(i) more than 60 marks
(ii) less than 56 marks
(iii) between 45 and 65 marks.
Step 1a
|
|
Identify the mean,standard deviation . |
|
Explanation: \$\mu\$ = Mean = 60 \$\sigma\$ = standard deviation = 5 \$Z = (X-\mu )/ \sigma = (X-60)/5\$ |
|
Step 1b
|
|
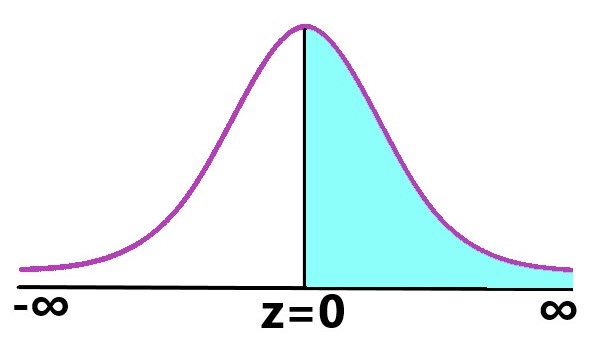
Finding more than 60 marks i.e,P (X > 60) |
|
Explanation: \$P (X > 60) = P((X-60)/5 > (60-60)/5)\$ P (X > 60) = P(Z > 0) P (X > 60) = P(0<Z<∞) P (X > 60) = 0.5000 (from Z-table) Students scored more than 60 marks = 0.5000 × 100 = 50% |
|
Step 1c
|
|
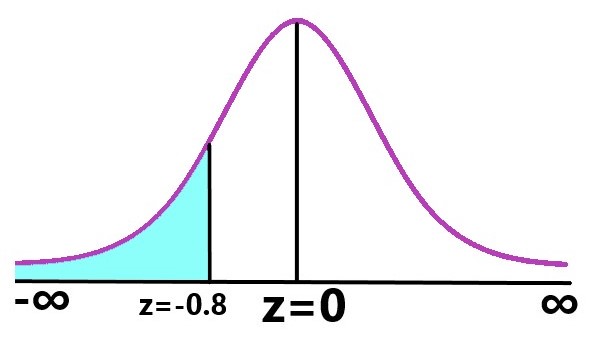
Finding less than 56 marks i.e,P (X < 56) |
|
Explanation: \$P (X < 56) = P((X-60)/5<(56-60)/5)\$ P (X < 56) = P(Z< -0.8) P(Z< -0.8) = P(-∞<Z<0) - P(-0.8< Z<0) P(Z< -0.8) = (area from 0 to -∞) - (area from 0 to 0.8) P(Z< -0.8) = 0.50 - P(0<Z<0.8) P(Z< -0.8) = 0.50 - 0.2881 (from Z-table) P(Z< -0.8) = 0.2119 Number of students scored less than 50 marks = 0.2119 × 100 = 21.19% |
|
Step 1d
|
|
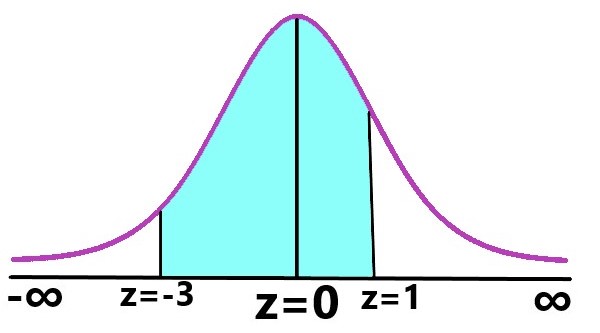
Finding between 45 and 65 marks i.e,P (45 < X < 65) |
|
Explanation: \$P (45 < X < 65) = P((45-60)/5 < Z < (65-60)/5)\$ P (45 < X < 65) = P(-3 < Z < 1) P(-3 < Z < 1) = P(0<Z<3) + P(0<Z<1) P(-3 < Z < 1) = ( area between 0 to 3) + (area between 0 to 1) P(-3 < Z < 1) = 0.4986 + 0.3413 (from Z-table) = 0.8399 Number of students scored between 45 and 60 marks = 0.8399 x 100= 83.99% |
|
Copyright © 2020-2022 saibook.us Contact: info@saibook.us Version: 1.5 Built: 27-February-2023 06:00 AM EST