Lesson Example Discussion Quiz: Class Homework |
Example |
Title: Mode for grouped data |
Grade: 9-a Lesson: S1-L6 |
Explanation: The best way to understand statistics is by looking at some examples. Take turns and read each example for easy understanding. |
Examples:
Find out the mode for the given observations
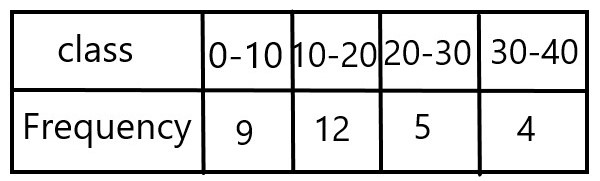
Step 1a
|
|
Maximum class frequency |
|
Explanation: Now Find the maximum of the frequency. i.e, \$12\$. |
|
Step 1b
|
|
Finding modal class |
|
Explanation: Modal class = 10-20 class size = 20-10 i.e, \$ h = 10\$ |
|
Step 1c
|
|
Calculating Mode |
|
Explanation: \$Mode = l + (f_1 - f_0)/(2f_1 - f_0 - f_2) × h\$ Here \$l = 10, f_0 = 9, f_1 = 12, f_2 = 5, h = 10\$ \$Mode = 10 + (12 - 9)/(2(12) - 9 - 5) × 10\$ \$= 10 + 3/(24 - 9 - 5) × 10\$ \$= 10 + 3/(24-14) × 10\$ \$= 10 + 3/10 × 10\$ \$= 10 + 0.3 × 10\$ \$= 10 + 3\$ \$Mode = 13\$ |
|
Copyright © 2020-2022 saibook.us Contact: info@saibook.us Version: 1.5 Built: 13-March-2023 06:00 AM EST