Lesson Example Discussion Quiz: Class Homework |
Quiz Discussion |
Title: Statistics |
Grade: Core-SAT3 Lesson: S8-P2 |
Explanation: Let us discuss a few questions on this topic and review the answers to every question. |
Quiz: Discussion in Class
| Problem Id | Problem | Options |
|---|---|---|
Steps 1 |
Calculate the standard deviation for the sample weights (in grams): 62.3, 74.1, 51.8, 23.5, 25.2, 40.9, and 93.2. |
A) 25.61 B) 25.09 C) 24.98 D) 24.37 |
Steps 2 |
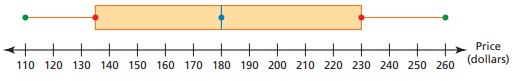
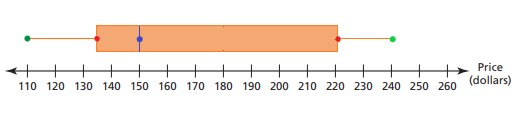
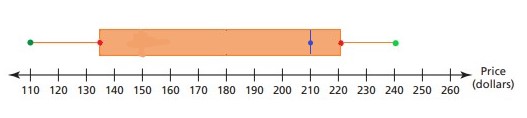
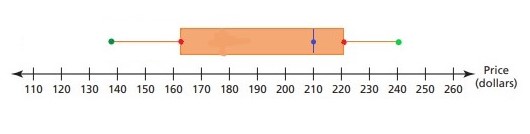
The data set shows the prices (in dollars) of lacrosse helmets. Make a box-and-whisker plot that represents the data. Describe the distribution: 125, 120, 250, 110, 190, 220, 145, 260, 240, 150, 170, and 200. |
A) B) C) D) |
Steps 3 |
Use the Venn diagrams you drew in Exercises 1–3 to decide whether the statement is true or false. Explain your reasoning. The only positive factors of 12 less than 13 that are not even are 1 and 3. |
A) FALSE B) Both C) TRUE D) None of these |
Steps 4 |
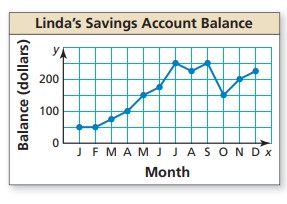
Use the line graph to answer each question. In which month(s) was Linda’s account balance $150?
|
A) January and May B) June and July C) October and December D) May and October |
Steps 5 |
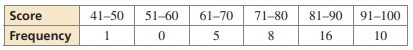
The frequency table shows the chemistry exam scores for a class. Display the data in a histogram. Describe the distribution.
|
A) 3 B) 0 C) 5 D) 7 |
Copyright © 2020-2022 saibook.us Contact: info@saibook.us Version: 1.5 Built: 09-October-2024 09:20AM EST