Lesson Example Discussion Quiz: Class Homework |
Quiz In Class |
Title: Statistics |
Grade: Core-SAT3 Lesson: S8-P2 |
Explanation: Hello Students, time to practice and review. Let us take next 10-15 minutes to solve the ten problems using the Quiz Sheet. Then submit the quiz to get the score. This is a good exercise to check your understanding of the concepts. |
Quiz: in Class
| Problem Id | Problem | Options |
|---|---|---|
1 |
Make a box-and-whisker plot that represents the data. Describe the distribution. Test scores: 80, 85, 95, 82, 92, 98, 96, 85, 90, 93, 65, and 87. |
A) Unsymmetric B) Symmetric C) Negative skewed D) Positive skewed |
2 |
Calculate the Mean Absolute Deviation (MAD) for the sample weights (in grams) measured in a chemical reaction: 52.3, 54.1, 51.8, 53.5, 55.2, 50.9, 56.3, 54.9, 51.6, and 53.2. |
A) 1.53 grams B) 1.42 grams C) 1.525 grams D) 1.45 grams |
3 |
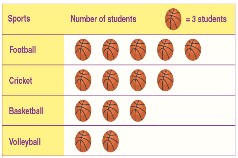
What is the total number of students who like the sports shown in the pictograph?
|
A) 60 students B) 58 students C) 54 students D) 62 students |
4 |
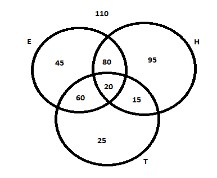
What is the total number of people surveyed?
|
A) 450 B) 400 C) 300 D) 350 |
5 |
The test scores of 25 students in a class are as follows: 18, 34, 45, 78, 39, 60, 81, 32, 90, 95, 85, 25, 15, 88, 50, 40, 91, 79, 34, 85, 13, 35, 89, 87, and 94. Make a box-and-whisker plot that represents the data. Describe the distribution. |
A) IQR: 57 B) IQR: 54.5 C) IQR: 51.5 D) IQR: 59 |
6 |
If a pizza is cut into 8 equal slices and you eat 3 slices, what percentage of the pizza did you eat? |
A) 37.50% B) 40% C) 30% D) 46% |
7 |
Identify any outliers in the following data set of monthly electricity bills (in dollars): 90, 95, 100, 105, 110, 115, 120, 125, 130, 135, 140, 145, 150, 155, 160, 165, 170, 175, 180, 185, 190, 195, 200, 210, and 250. |
A) 190 as an outlier B) 210 as an outlier C) No outliers D) 250 as an outlier |
8 |
Calculate the Mean Absolute Deviation (MAD) for the weekly temperatures in Celsius: 22, 24, 23, 25, 27, 26, and 21. |
A) 1.69 degrees B) 1.78 degrees C) 1.71 degrees D) 1.63 degrees |
9 |
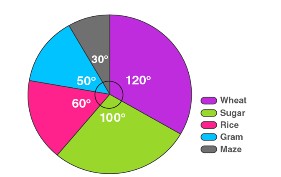
What fraction of the pie chart is occupied by Sugar and Gram together?
|
A) \$7 / 13\$ B) \$5 / 12\$ C) \$6 / 13\$ D) \$7 / 12\$ |
10 |
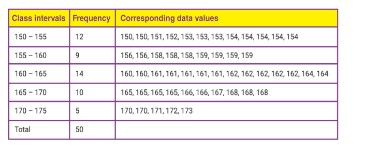
How many people are between 160 cm and 165 cm tall?
|
A) 18 B) 16 C) 20 D) 14 |
Copyright © 2020-2022 saibook.us Contact: info@saibook.us Version: 1.5 Built: 09-October-2024 09:20AM EST