Lesson Example Discussion Quiz: Class Homework |
Quiz In Class |
Title: Statistics |
Grade: Best-SAT3 Lesson: S8-P2 |
Explanation: Hello Students, time to practice and review. Let us take next 10-15 minutes to solve the ten problems using the Quiz Sheet. Then submit the quiz to get the score. This is a good exercise to check your understanding of the concepts. |
Quiz: in Class
| Problem Id | Problem | Options |
|---|---|---|
1 |
In a class, student ages are 18, 19, 20, 21, 22, x, and 24. With a mean of 21 and a mean absolute deviation of 1.714, determine the value of 'x' and the sum of 'x' and the lower value. |
A) 49 B) 42 C) 38 D) 44 |
2 |
The heights (in centimeters) of a group of people are as follows: 148, 150, 152, 155, 157, 160, 162, 165, 168, 170, 173, 175, 178, 180, 183, 185, 188, 190, 193, 195, 198, 200, 203, 205, and 210. Determine the interquartile range (IQR). |
A) 29.8 B) 28.6 C) 30.5 D) 31.3 |
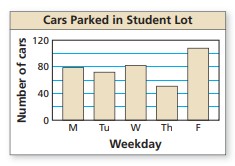
3 |
On which day of the week were the least number of cars parked in the student lot?
|
A) Thursday B) Friday C) Monday D) Tuesday |
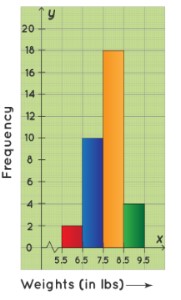
4 |
Consider the following histogram that represents the weights of 34 newborn babies in a hospital. If the children weighing between 6.5 lb to 8.5 lb are considered healthy, then find the percentage of the children of this hospital that are healthy.
|
A) 87% B) 85% C) 89% D) 83% |
5 |
If a shirt originally costs $40 and is now on sale for 25% off, what is the sale price? |
A) $33 B) $36 C) $30 D) $39 |
6 |
If a car depreciates in value by 15% each year, and its original value was $20,000, what will its value be after 3 years? |
A) $15,258.20 B) $16,552.52 C) $13,355.65 D) $12,282.50 |
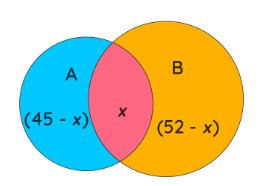
7 |
Consider the following dataset representing the number of hours studied by students in a week: 4, 5, 7, 8, 8, 10, 10, 12, 13, 15, 16, 16, 18, 20, 25, and 45. Determine if there are any outliers in the dataset using the 1.5 \times IQR rule. |
A) 52 B) 45 C) 47 D) 49 |
8 |
In a class of 70 students, 45 students like to play Soccer. 52 students like to play Baseball. All the students like to play at least one of the two games. How many students like to play Soccer or Baseball? How many students like to play only Soccer?
|
A) 18 B) 25 C) 28 D) 27 |
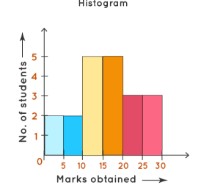
9 |
How many students are obtained 30 marks?
|
A) 4 students B) 5 students C) 2 students D) 3 students |
10 |
Data Set 2: 102, 105, 108, 110, 115, 120, 122, 125, 128, 130, 135, 140, 142, 145, 150, 155, 160, 162, 165, 170, and 200. Calculate the first quartile (Q1), third quartile (Q3), and interquartile range (IQR) for the data set. Determine the lower and upper bounds for identifying outliers using the 1.5 \times IQR rule. |
A) Lower Bound: 697.5 B) Lower Bound: 687.5 C) Lower Bound: 617.5 D) Lower Bound: 637.1 |
Copyright © 2020-2022 saibook.us Contact: info@saibook.us Version: 1.5 Built: 09-October-2024 09:20AM EST