Quiz At Home |
|
Title: Statistics |
Grade: 1400-a Lesson: T1-P1 |
Explanation: Hello Students, time to practice and review. Let us take next 10-15 minutes to solve the ten problems using the Quiz Sheet. Then submit the quiz to get the score. This is a good exercise to check your understanding of the concepts. |
Quiz: at Home
| Problem Id | Problem | Options |
|---|---|---|
1 |
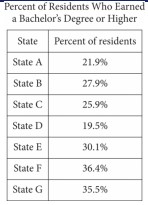
A survey was given to residents of all 50 states asking if they had earned a bachelor’s degree or higher. The results from 7 of the states are given in the table above. The median percent of residents who earned a bachelor’s degree or higher for all 50 states was 26.95%. What is the difference between the median percent of residents who earned a bachelor’s degree or higher for these 7 states and the median for all 50 states?
|
A) 0.95% B) 1.22% C) 0.05% D) 7.45% |
2 |
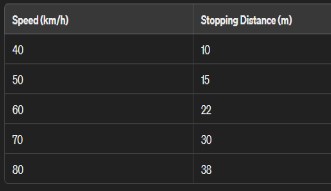
A car manufacturer wants to study the relationship between the speed of a car (in km/h) and the distance it takes to stop (in meters) under emergency braking conditions. The data for a sample of 5 cars is given below:
|
A) a) 14.56 B) a) 14.14 C) a) 15.23 D) a) 16.58 |
3 |
Suppose you have a standard deck of 52 playing cards. If you draw two cards at random without replacement, what is the probability that both cards are face cards (i.e., jacks, queens, or kings)? |
A) \$2/21\$ B) \$4/21\$ C) \$1/21\$ D) \$5/21\$ |
4 |
In a survey conducted among 150 members of a fitness club, 60 members indicated that they were interested in participating in a new yoga class. The fitness club has a total membership of 500 members. Based on this survey, estimate how many members in total would be interested in participating in the new yoga class. |
A) 190 B) 210 C) 195 D) 200 |
5 |
If a factory produces 500 units of a product every hour, and it operates for 8 hours a day, how many units does it produce in a week? |
A) 27,000 B) 28,500 C) 27,500 D) 28,000 |
6 |
Data set A and data set B each consist of values. The table shows the frequencies of the values for each data set. Which of the following statements best compares the means of the two data sets? |
A) The mean of data set A is equal to the mean of data set B. B) The mean of data set A is less than the mean of data set B. C) The mean of data set A is greater than the mean of data set B. D) There is not enough information to compare the means of the data sets. |
7 |
For x > 0, the function f is defined as follows: |
A) Increasing exponential. B) Increasing linear. C) Decreasing exponential. D) Decreasing linear. |
8 |
In a bag, there are 10 red, 14 white, 50 blue, and 63 yellow cubes. If one of these cubes is selected at random, what is the probability of selecting a cube that is neither blue nor yellow? |
A) 0.17 B) 0.23 C) 2.56 D) 1.25 |
9 |
In a survey conducted in a city with a population of 50,000, a random sample of 500 residents was asked about their preferred mode of transportation to work. Among the sample, 200 residents reported using cars as their primary mode of transportation. What is the estimated number of residents in the city who use cars as their primary mode of transportation to work? |
A) 20,100 B) 20,000 C) 19,900 D) 19,800 |
10 |
A survey was conducted using a sample of history professors selected at random from the California State Universities. The professors surveyed were asked to name the publishers of their current texts. What is the largest population to which the results of the survey can be generalized? |
A) All history professors in the United States. B) All professors at all California State Universities. C) All history professors at all California State Universities. D) All professors in the United States. |
Copyright © 2020-2022 saibook.us Contact: info@saibook.us Version: 1.5 Built: 05-June-2024 09:20AM EST