Quiz In Class |
|
Title: Statistics |
Grade: 1400-a Lesson: T1-P1 |
Explanation: Hello Students, time to practice and review. Let us take next 10-15 minutes to solve the ten problems using the Quiz Sheet. Then submit the quiz to get the score. This is a good exercise to check your understanding of the concepts. |
Quiz: in Class
| Problem Id | Problem | Options |
|---|---|---|
1 |
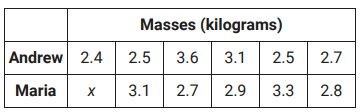
Andrew and Maria each collected six rocks, and the masses of the rocks are shown in the table above. The mean of the masses of the rocks Maria collected is 0.1 kilograms greater than the mean of the masses of the rocks Andrew collected. What is the value of x?
|
A) 2.6 B) 2.2 C) 2.9 D) 2 |
2 |
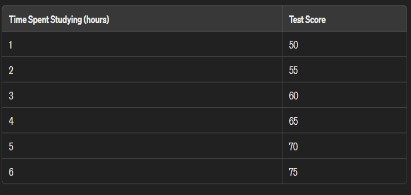
A researcher wants to study the relationship between the amount of time spent studying (in hours) and the score obtained on a test. The data for a sample of 6 students is given below:
|
A) a) 2.669 B) a) 2.229 C) a) 3.254 D) a) 3.587 |
3 |
A bag contains 5 red marbles, 3 blue marbles, and 2 green marbles. If one marble is drawn at random from the bag, what is the probability that it is blue? |
A) \$7/20\$ B) \$6/10\$ C) \$3/10\$ D) \$9/20\$ |
4 |
In a city with a population of 10,000 residents, a survey is conducted to determine the proportion of residents who support a new public transportation initiative. A random sample of 500 residents is taken, and it is found that 250 of them support the initiative. Based on this sample, estimate the total number of residents in the city who support the new public transportation initiative. |
A) 5100 B) 4900 C) 4750 D) 5000 |
5 |
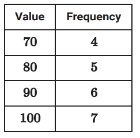
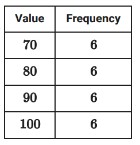
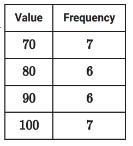
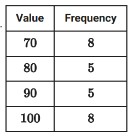
Each of the following frequency tables represents a data set. Which data set has the greatest mean? |
A) B) C) D) |
6 |
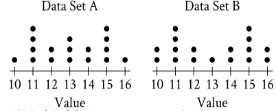
The dot plots represent the distributions of values in data sets A and B.
Which of the following statements must be true?
|
A) I and ll B) II only C) I only D) Neither I nor II |
7 |
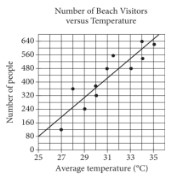
Each dot in the scatterplot above represents the temperature and the number of people who visited a beach in Lagos, Nigeria, on one of eleven different days. The line of best fit for the data is also shown. The line of best fit for the data has a slope of approximately 57. According to this estimate, how many additional people per day are predicted to visit the beach for each 5°C increase in average temperature?
|
A) 291 B) 285 C) 287 D) 289 |
8 |
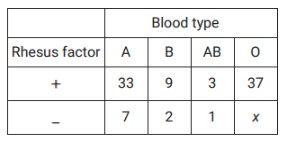
Human blood can be classified into four common blood types - A, B, AB, and O. It is also characterized by the presence or absence of the rhesus factor. The table above shows the distribution of blood type and rhesus factor for a group of people. If one of these people who is rhesus negative is chosen at random, the probability that the person has blood type B is 1/9. What is the value of x?
|
A) 8 B) 7 C) 9 D) 6 |
9 |
A sample of 60 fourth-grade students was selected at random from a certain school. The 60 students completed a survey about the morning announcements, and 52 thought the announcements were helpful. Which of the following is the largest population to which the results of the survey can be applied? |
A) All fourth-grade students in the district. B) All fourth-grade students in the school. C) All students in the school. D) All students in the state. |
10 |
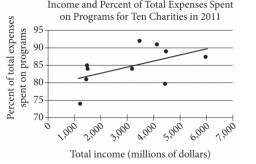
The scatterplot above shows data for ten charities along with the line of best fit. For the charity with the greatest percent of total expenses spent on programs, which of the following is closest to the difference between the actual percent and the percent predicted by the line of best fit?
|
A) 3% B) 1% C) 7% D) 10% |
Copyright © 2020-2022 saibook.us Contact: info@saibook.us Version: 1.5 Built: 05-June-2024 09:20AM EST