Lesson Example Discussion Quiz: Class Homework |
Quiz At Home |
Title: Two-Variable Data |
Grade: 1400-a Lesson: S4-L2 |
Explanation: Hello Students, time to practice and review. Let us take next 10-15 minutes to solve the ten problems using the Quiz Sheet. Then submit the quiz to get the score. This is a good exercise to check your understanding of the concepts. |
Quiz: at Home
| Problem Id | Problem | Options |
|---|---|---|
1 |
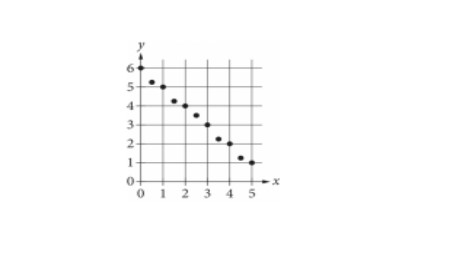
Which of the following could be an equation for a line of best fit for the data in the scatterplot?
|
A) y = - x - 6 B) y = - x + 6 C) y = 6x + 1 D) y = 6x - 1 |
2 |
An airplane descends from an altitude 9,500 of feet to 5,000 feet at a constant rate of 400 feet per minute. What type of function best models the relationship between the descending airplane’s altitude and time? |
A) Decreasing exponential B) Decreasing linear C) Increasing exponential D) Increasing linear |
3 |
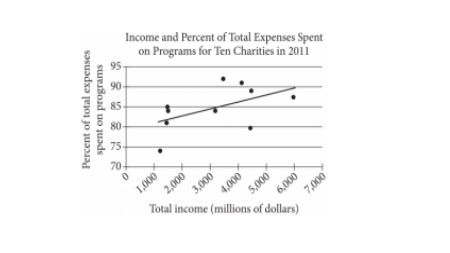
The scatterplot above shows data for ten charities along with the line of best fit. For the charity with the greatest percent of total expenses spent on programs, which of the following is closest to the difference of the actual percent and the percent predicted by the line of best fit?
|
A) 1% B) 3% C) 10% D) 7% |
4 |
An inspector begins a day of work with a large sample of shirts that need to be checked for defects. The inspector works at a constant rate throughout the morning. What type of model is best to model the number of shirts remaining to be checked for defects at any given time throughout the morning? |
A) A linear model with a positive slope. B) An exponential decay model. C) An exponential growth model. D) A linear model with a negative slope. |
5 |
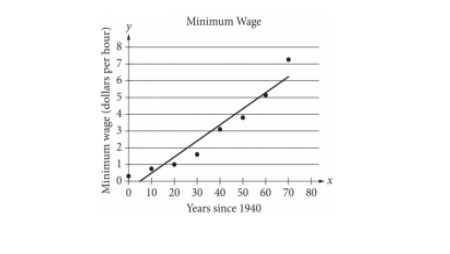
The scatterplot above shows the federal-mandated minimum wage every 10
years between 1940 and 2010.
|
A) Each year between 1940 and 2010, the average increase in minimum wage was 0.49 dollars. B) Every 10 years between 1940 and 2010, the average increase in minimum wage was 0.096 dollars. C) Each year between 1940 and 2010, the average increase in minimum wage was 0.096 dollars. D) Every 10 years between 1940 and 2010, the average increase in minimum wage was 0.488 dollars. |
6 |
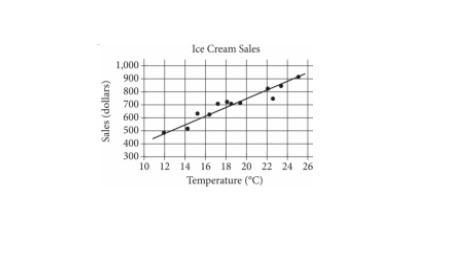
The scatterplot above shows a company’s ice cream sales d, in dollars, and the high temperature t, in degrees Celsius (°C), on 12 different days. A line of best fit for the data is also shown. Which of the following could be an equation of the line of best fit?
|
A) d = 10t + 402 B) d = 33t + 300 C) d = 33t + 84 D) d = 0.03t + 402 |
7 |
For x > 0 , the function f is defined as follows: |
A) Increasing linear B) Increasing exponential C) Decreasing linear D) Decreasing exponential |
8 |
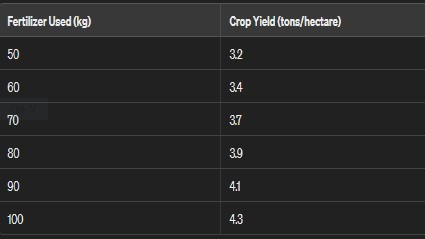
A farmer wants to analyze the relationship between the amount of fertilizer used (in kilograms) and the crop yield (in tons per hectare) for a particular crop. The data for a sample of 6 fields is given below:
|
A) a) 22.17 B) a) 22.36 C) a) 23.23 D) a) 23.56 |
9 |
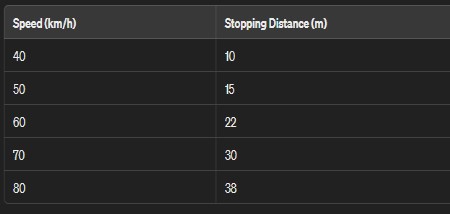
A car manufacturer wants to study the relationship between the speed of a car (in km/h) and the distance it takes to stop (in meters) under emergency braking conditions. The data for a sample of 5 cars is given below:
|
A) a) 14.56 B) a) 14.14 C) a) 15.23 D) a) 16.58 |
10 |
A researcher wants to study the relationship between the amount of time spent studying (in hours) and the score obtained on a test. The data for a sample of 6 students is given below:
|
A) a) 2.669 B) a) 2.229 C) a) 3.254 D) a) 3.587 |

Copyright © 2020-2022 saibook.us Contact: info@saibook.us Version: 1.5 Built: 18-June-2024 09:20AM EST