Lesson Example Discussion Quiz: Class Homework |
Quiz In Class |
Title: Two-Variable Data |
Grade: 1400-a Lesson: S4-L2 |
Explanation: Hello Students, time to practice and review. Let us take next 10-15 minutes to solve the ten problems using the Quiz Sheet. Then submit the quiz to get the score. This is a good exercise to check your understanding of the concepts. |
Quiz: in Class
| Problem Id | Problem | Options |
|---|---|---|
1 |
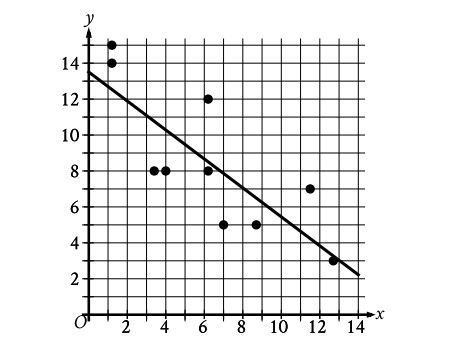
The scatterplot shows the relationship between two variables, x and y.
|
A) y = 13.5 + 0.8x B) y = 13.5 - 0.8x C) y = - 13.5 + 0.8x D) y = - 13.5 - 0.8x |
2 |
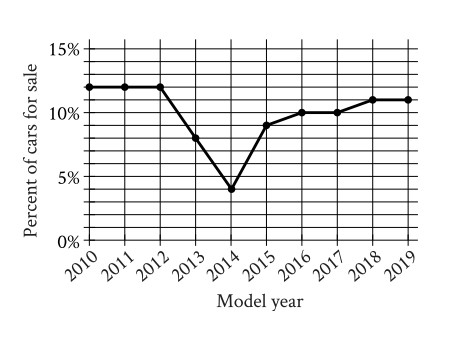
The line graph shows the percent of cars for sale at a used car lot on a given day by model year. For what model year is the percent of cars for sale the smallest?
|
A) 2013 B) 2014 C) 2012 D) 2015 |
3 |
Which of the following is true about the value of |
A) For all x > 0, it is true that \$2^x\$, 2x + 2. B) For all x > 0, it is true that \$2^x\$ < 2x + 2. C) There is a constant c such that if 0 < x < c, then \$2^x\$ > 2x + 2, but if x > c, then \$2^x\$ < 2x + 2. D) There is a constant c such that if 0 < x < c, then \$2^x\$ < 2x + 2, but if x > c, then \$2^x\$ > 2x + 2. |
4 |
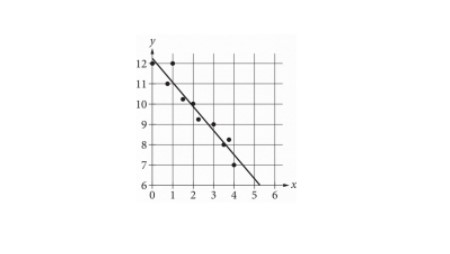
The scatterplot shows the relationship between two variables, x and y.
|
A) 7 B) 0.7 C) - 7 D) - 0.7 |
5 |
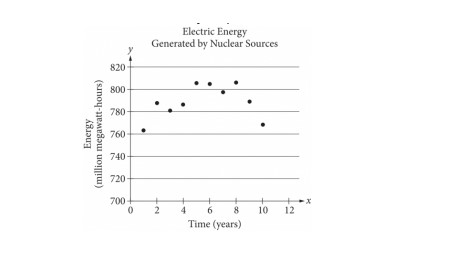
The scatterplot below shows the amount of electric energy generated, in millions of megawatt-hours, by nuclear sources over a 10‑year period of the following equations, which best models the data in the scatterplot?
|
A) y = \$1.674 "x"^2 + 19.76 "x" - 745.73 \$ B) y = \$1.674 "x"^2 - 19.76 "x" - 745.73 \$ C) y = \$- 1.674 "x"^2 + 19.76 "x" + 745.73 \$ D) y = \$1.674 "x"^2 - 19.76 "x" + 745.73 \$ |
6 |
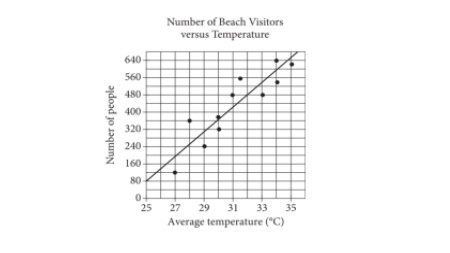
Each dot in the scatterplot above represents the temperature and the number of
people who visited a beach in Lagos, Nigeria, on one of eleven different days.
|
A) 289 B) 287 C) 285 D) 291 |
7 |
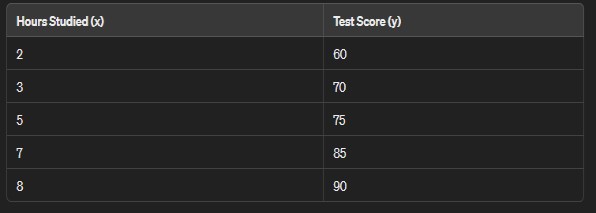
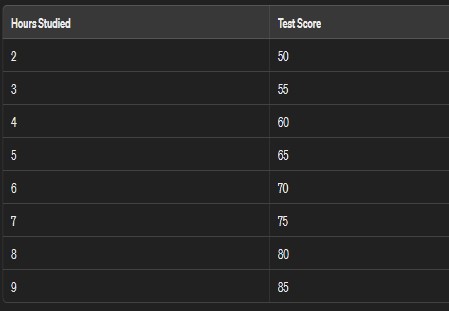
The following table shows the number of hours students studied and their corresponding test scores:
|
A) a) 76 B) a) 78 C) a) 80 D) a) 56 |
8 |
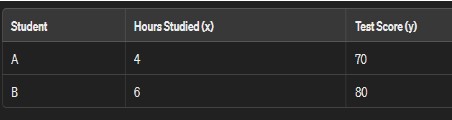
The following table shows the number of hours students studied and the corresponding test scores for two students:
|
A) 0.13 B) 0.15 C) 0.17 D) 0.19 |
9 |
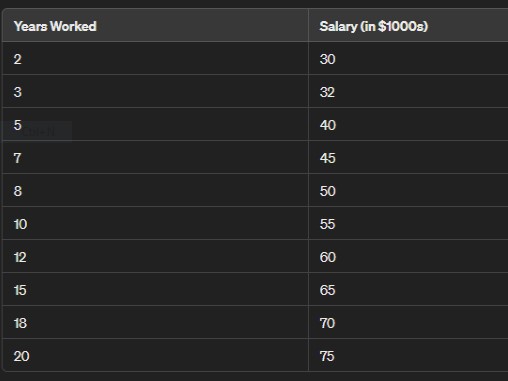
A company conducted a survey to study the relationship between the number of years an employee has worked at the company and their annual salary. The data for a sample of 10 employees is given below:
|
A) a) 6.23 B) a) 5.86 C) a) 5.89 D) a) 6.78 |
10 |
A researcher wants to investigate the relationship between the number of hours studied and the score obtained on a test. The data for a sample of 8 students is given below:
|
A) a) 5.48 B) a) 5.43 C) a) 6.23 D) a) 5.36 |
Copyright © 2020-2022 saibook.us Contact: info@saibook.us Version: 1.5 Built: 18-June-2024 09:20AM EST