Lesson Example Discussion Quiz: Class Homework |
Quiz At Home |
Title: One Variable Data |
Grade: 1400-a Lesson: S4-L1 |
Explanation: Hello Students, time to practice and review. Let us take next 10-15 minutes to solve the ten problems using the Quiz Sheet. Then submit the quiz to get the score. This is a good exercise to check your understanding of the concepts. |
Quiz: at Home
| Problem Id | Problem | Options |
|---|---|---|
1 |
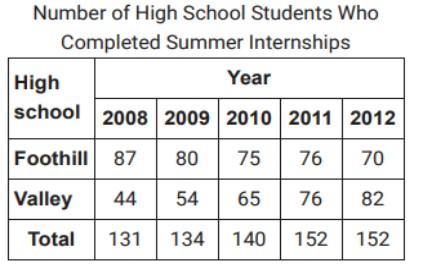
The table above shows the number of students from two different high schools who completed summer internships in each of five years. No student attended
both schools. Which of the following statements are true about the number of
students who completed summer internships for the 5 years shown?
|
A) II only B) I and II C) I only D) Neither I nor II |
2 |
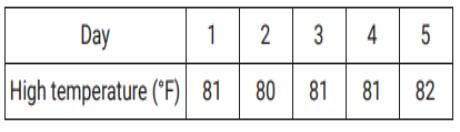
The high temperature, in degrees Fahrenheit (°F), in a certain city was recorded for each of 5 days. The data are shown below. Over this 5-day period, which of the following is NOT equal to 81°F?
|
A) Median of the high temperatures. B) Mean of the high temperatures. C) Range of the high temperatures. D) Mode of the high temperatures. |
3 |
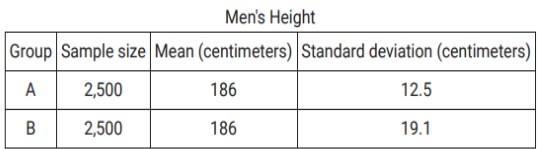
The results of two independent surveys are shown in the table below. Which statement is true based on the table?
|
A) The Group A data set was identical to the Group B data set. B) Group B contained the tallest participant. C) The median height of Group B is larger than the median height of Group A. D) The heights of the men in Group B had a larger spread than the heights of the men in Group A. |
4 |
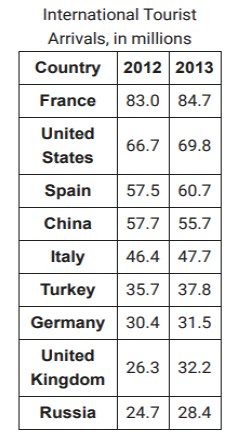
The table above shows the number of international tourist arrivals, rounded to the nearest tenth of a million, to the top nine tourist destinations in both 2012 and 2013. Based on the information given in the table, how much greater, in millions, was the median number of international tourist arrivals to the top nine tourist destinations in 2013 than the median number in 2012, to the nearest tenth of a million?
|
A) 1.3 Million B) 1.5 Million C) 1.1 Million D) 1.8 Million |
5 |
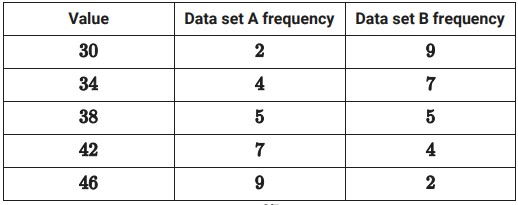
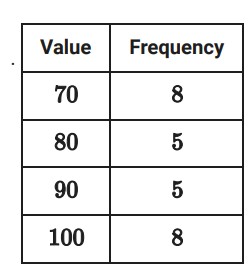
Data set A and data set B each consist of values. The table shows the frequencies of the values for each data set.
|
A) The mean of data set A is greater than the mean of data set B. B) The mean of data set A is less than the mean of data set B. C) The mean of data set A is equal to the mean of data set B. D) There is not enough information to compare the means of the data sets. |
6 |
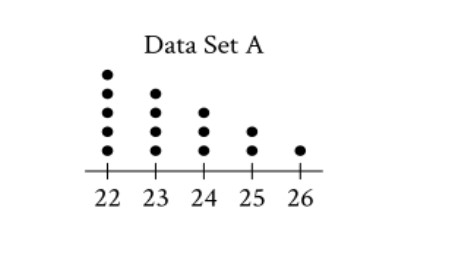
The dot plot represents the 15 values in data set A. Data set B is created by adding 56 to each of the values in data set A.
|
A) The median of data set B is greater than the median of data set A, and the range of data set B is equal to the range of data set A. B) The median of data set B is equal to the median of data set A, and the range of data set B is greater than the range of data set A. C) The median of data set B is equal to the median of data set A, and the range of data set B is equal to the range of data set A. D) The median of data set B is greater than the median of data set A, and the range of data set B is greater than the range of data set A. |
7 |
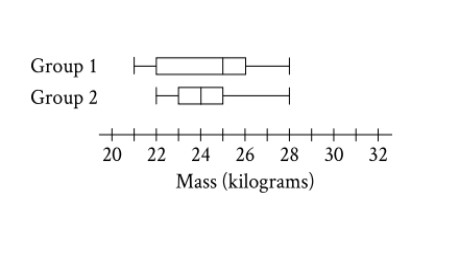
The box plots summarize the masses, in kilograms, of two groups of gazelles. Based on the box plots, which of the following statements must be true?
|
A) The median mass of group 1 is greater than the median mass of group 2. B) The mean mass of group 1 is less than the mean mass of group 2. C) The mean mass of group 1 is greater than the mean mass of group 2. D) The median mass of group 1 is less than the median mass of group 2. |
8 |
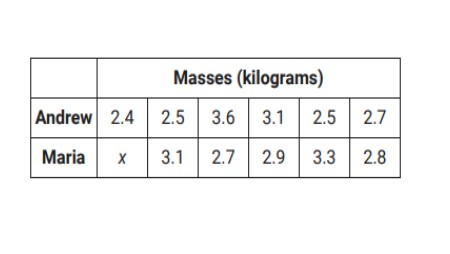
Andrew and Maria each collected six rocks, and the masses of the rocks are shown in the table above. The mean of the masses of the rocks Maria collected is 0.1 kilogram greater than the mean of the masses of the rocks Andrew collected. What is the value of x ?
|
A) 2.2 B) 2.6 C) 2.9 D) 2 |
9 |
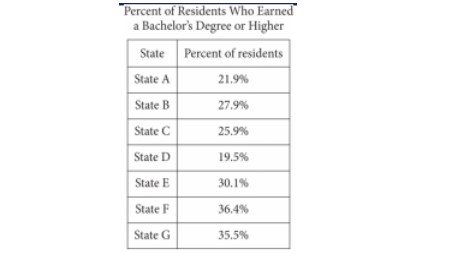
A survey was given to residents of all 50 states asking if they had earned a bachelor’s degree or higher. The results from 7 of the states are given in the table above. The median percent of residents who earned a bachelor’s degree or higher for all 50 states was 26.95%. What is the difference between the median percent of residents who earned a bachelor’s degree or higher for these 7 states and the median for all 50 states?
|
A) 0.05% B) 1.22% C) 0.95% D) 7.45% |
10 |
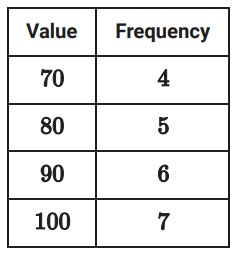
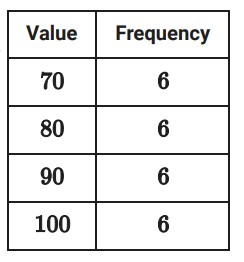
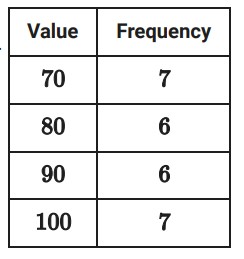
Each of the following frequency tables represents a data set. Which data set has the greatest mean? |
A) B) C) D) |
Copyright © 2020-2022 saibook.us Contact: info@saibook.us Version: 1.5 Built: 18-June-2024 09:20AM EST