Lesson Example Discussion Quiz: Class Homework |
Quiz In Class |
Title: One Variable Data |
Grade: 1400-a Lesson: S4-L1 |
Explanation: Hello Students, time to practice and review. Let us take next 10-15 minutes to solve the ten problems using the Quiz Sheet. Then submit the quiz to get the score. This is a good exercise to check your understanding of the concepts. |
Quiz: in Class
| Problem Id | Problem | Options |
|---|---|---|
1 |
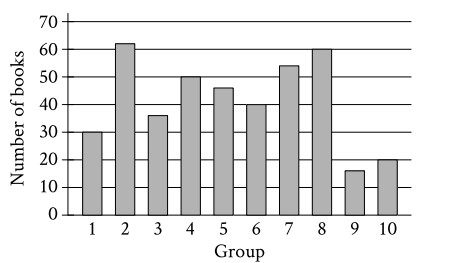
The bar graph shows the distribution of 414 books collected by 10 different groups for a book drive. How many books were collected by group 1?
|
A) 45 B) 30 C) 54 D) 20 |
2 |
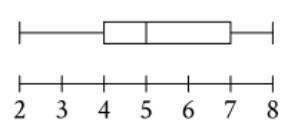
The box plot summarizes 15 data values. What is the median of this data set?
|
A) 2 B) 3 C) 5 D) 8 |
3 |
The weights, in pounds, for 15 horses in a stable were reported, and the mean, median, range, and standard deviation for the data were found. The horse with the lowest reported weight was found to actually weigh 10 pounds less than its reported weight. What value remains unchanged if the four values are reported using the corrected weight? |
A) Mean B) Standard Deviation C) Range D) Median |
4 |
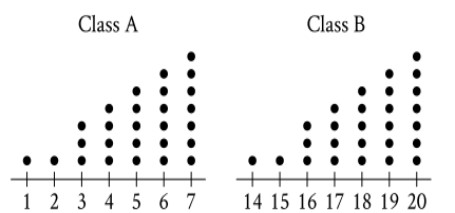
Each of the dot plots shown represents the number of glue sticks brought in by each student for two classes, class A and class B. Which statement best compares the standard deviations of the numbers of glue sticks brought in by each student for these two classes?
|
A) The standard deviation of the number of glue sticks brought in by each student for class A is equal to the standard deviation of the number of glue sticks brought in by each student for class B. B) The standard deviation of the number of glue sticks brought in by each student for class A is less than the standard deviation of the number of glue sticks brought in by each student for class B. C) The standard deviation of the number of glue sticks brought in by each student for class A is greater than the standard deviation of the number of glue sticks brought in by each student for class B. D) There is not enough information to compare these standard deviations. |
5 |
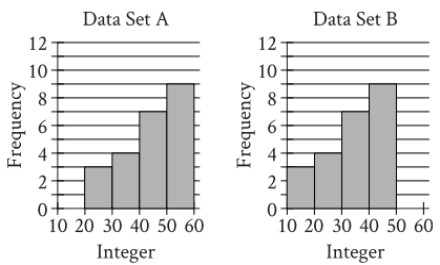
Two data sets of 23 integers each are summarized in the histograms shown. For each of the histograms, the first interval represents the frequency of integers greater than or equal to 10 , but less than 20. The second interval represents the frequency of integers greater than or equal to 20, but less than 30, and so on. What is the smallest possible difference between the mean of data set A and the mean of data set B?
|
A) 1 B) 0 C) 10 D) 23 |
6 |
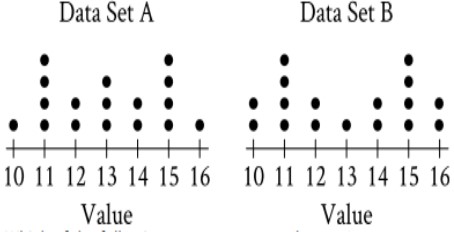
The dot plots represent the distributions of values in data sets A and B. Which of the following statements must be true?
|
A) I only B) II only C) I and II D) Neither I nor II |
7 |
Data set A consists of the heights of 45 buildings and has a mean of 70 meters. |
A) 82 B) 89 C) 93 D) 77 |
8 |
Two different teams consisting of 10 members each ran in a race. Each member’s completion time of the race was recorded. The mean of the completion times for each team was calculated and is shown below. |
A) I and III only B) III only C) II and III only D) I, II, and III |
9 |
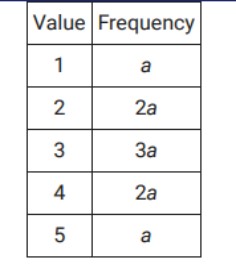
The frequency distribution above summarizes a set of data, where a is a positive integer. How much greater is the mean of the set of data than the median?
|
A) 2 B) 1 C) 0 D) 3 |
10 |
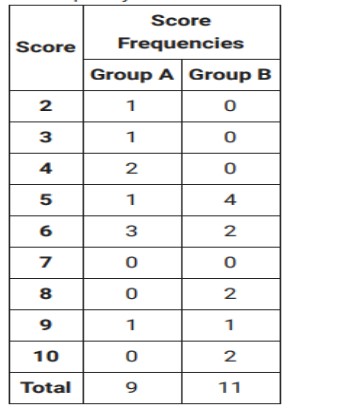
For a certain computer game, individuals receive an integer score that ranges from 2 through 10. The table below showsthe frequency distribution of the scores of the 9 players in group A and the 11 players in group B. The median of the scores for group B is how much greater than the median of the scores for group A?
|
A) 2 B) 4 C) 3 D) 1 |
Copyright © 2020-2022 saibook.us Contact: info@saibook.us Version: 1.5 Built: 18-June-2024 09:20AM EST