Lesson Example Discussion Quiz: Class Homework |
Step-5 |
Title: Pictographs, Frequent Tables, Histograms |
Grade: 1300-a Lesson: S4-L8 |
Explanation: Hello Students, time to practice and review the steps for the problem. |
Lesson Steps
| Step | Type | Explanation | Answer |
|---|---|---|---|
1 |
Problem |
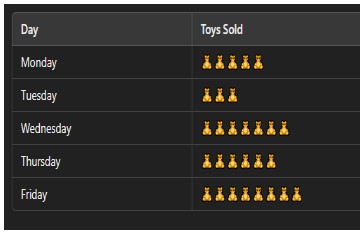
How many toys were sold on Wednesday?
|
|
2 |
Step |
Start with the given data for the number of toys sold each day of the week: Monday: 50. |
|
3 |
Step |
Locate the Day of Interest: In this case, the day of interest is Wednesday. |
|
4 |
Step |
Retrieve the Number for Wednesday: From the given data, find the number of toys sold on Wednesday, which is 70. |
|
5 |
Step |
Therefore, the number of toys sold on Wednesday is 70. |
|
6 |
Choice.A |
This option suggests that 79 toys were sold on Wednesday, but based on the information you provided (option D is correct), the actual number is lower |
79 |
7 |
Choice.B |
This option is also incorrect. Similar to option A, it suggests a slightly different number (74) compared to the actual number of toys sold on Wednesday (70) |
74 |
8 |
Choice.C |
This option is close, but not quite right. While it’s closer to the actual number (70) compared to options A and B, it’s still not the exact sales figure on Wednesday |
72 |
9 |
Choice.D |
This is the correct answer. It aligns with the information you confirmed, indicating that the data you have shows that 70 toys were sold on Wednesday |
70 |
10 |
Answer |
Option |
D |
11 |
Sumup |
Can you summarize what you’ve understood in the above steps? |
|
Copyright © 2020-2022 saibook.us Contact: info@saibook.us Version: 1.5 Built: 18-June-2024 09:20AM EST