Lesson Example Discussion Quiz: Class Homework |
Quiz At Home |
Title: Pictographs, Frequent Tables, Histograms |
Grade: 1300-a Lesson: S4-L8 |
Explanation: Hello Students, time to practice and review. Let us take next 10-15 minutes to solve the ten problems using the Quiz Sheet. Then submit the quiz to get the score. This is a good exercise to check your understanding of the concepts. |
Quiz: at Home
| Problem Id | Problem | Options |
|---|---|---|
1 |
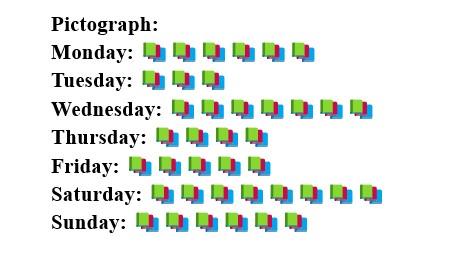
A bookstore recorded its sales for a week. The data is shown in the following pictograph, where each symbol represents 5 books sold: How many books were sold in total over the week?
|
A) 185 B) 190 C) 195 D) 200 |
2 |
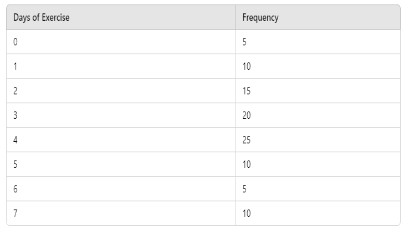
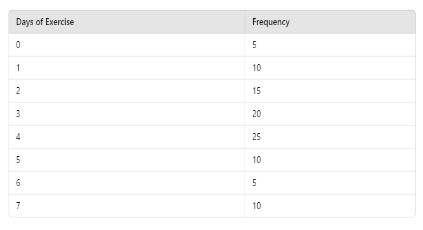
A survey was conducted to find out how many days per week people exercise. The results are shown in the following frequency table: How many people exercise 4 days a week?
|
A) 30 B) 20 C) 15 D) 25 |
3 |
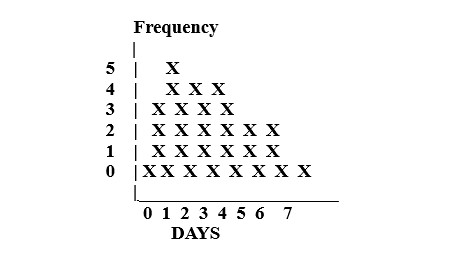
The histogram below represents the distribution of daily temperatures (in Celsius) for a city over a month. How many days were included in the survey?
|
A) 25 B) 28 C) 30 D) 33 |
4 |
An ice cream shop recorded the number of ice creams sold in different flavors over a month. The data is represented in the following pictograph, where each symbol represents 10 ice creams sold: Which flavor was sold the most?
|
A) Chocolate B) Vanilla C) Strawberry D) Cookie Dough |
5 |
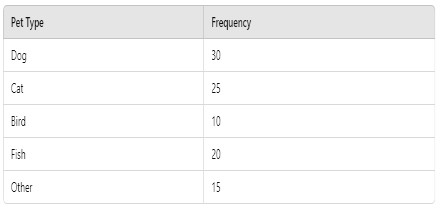
A neighborhood survey was conducted to find out the types of pets people have. The results are recorded in the following frequency table: What percentage of the pets are cats?
|
A) 25% B) 28% C) 22% D) 30% |
6 |
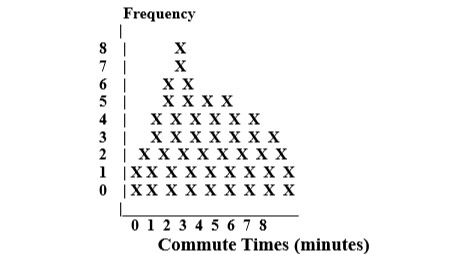
The histogram below displays the distribution of daily commute times (in minutes) for employees at a company. How many employees' commute times were recorded?
|
A) 40 B) 49 C) 53 D) 45 |
7 |
A charity organization recorded the amount of money donated by different sources over a year. Each symbol represents $1000: 🏢 - Corporations What is the total amount of money donated over the year?
|
A) $45,000 B) $46,000 C) $47,000 D) $44,000 |
8 |
A survey was conducted to find out how many days per week people exercise. The results are shown in the following frequency table: What percentage of people exercise 5 or more days a week?
|
A) 22% B) 30% C) 25% D) 28% |
9 |
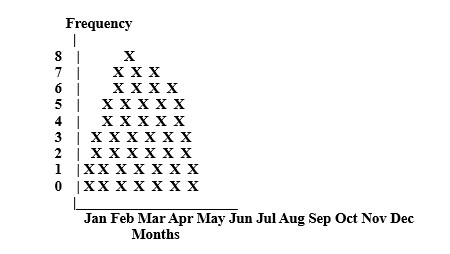
The following histogram represents the distribution of monthly rainfall (in inches) for a city over a year. What percentage of months had rainfall of 5 inches or higher?
|
A) 405% B) 406.96% C) 408.33% D) 410.17% |
10 |
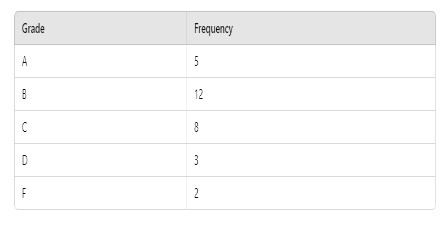
The grades of students in a math class are recorded in the following frequency table: What is the most common number of days people exercise per week?
|
A) grade D B) grade A C) grade C D) grade B |


Copyright © 2020-2022 saibook.us Contact: info@saibook.us Version: 1.5 Built: 18-June-2024 09:20AM EST