Lesson Example Discussion Quiz: Class Homework |
Quiz In Class |
Title: Pictographs, Frequent Tables, Histograms |
Grade: 1300-a Lesson: S4-L8 |
Explanation: Hello Students, time to practice and review. Let us take next 10-15 minutes to solve the ten problems using the Quiz Sheet. Then submit the quiz to get the score. This is a good exercise to check your understanding of the concepts. |
Quiz: in Class
| Problem Id | Problem | Options |
|---|---|---|
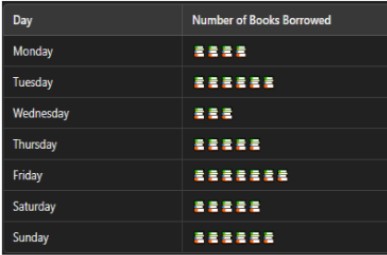
1 |
How many books were borrowed on Monday?
|
A) 30 books B) 22 books C) 20 books D) 35 books |
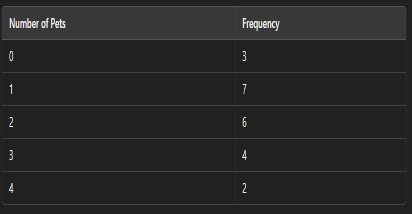
2 |
What is the mean number of pets owned by a family?
|
A) 4.25 pets B) 2.45 pets C) 3.56 pets D) 1.77 pets |
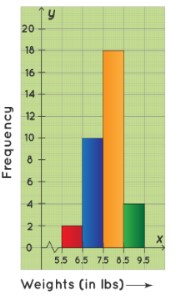
3 |
Consider the following histogram that represents the weights of 34 newborn babies in a hospital. If the children weighing between 6.5 lb to 8.5 lb are considered healthy, then find the percentage of the children of this hospital that are healthy.
|
A) 85% B) 83% C) 87% D) 89% |
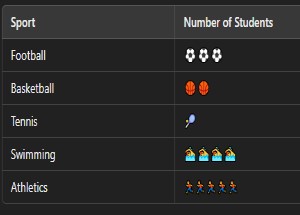
4 |
Which sport has the most participants?
|
A) 50 students B) 52 students C) 54 students D) 56 stdents |
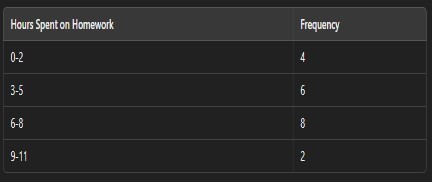
5 |
How many students spend less than 6 hours on homework?
|
A) 10 students B) 12 students C) 14 students D) 16 students |
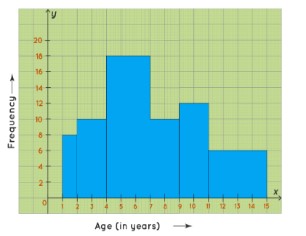
6 |
A random survey is done on the number of children belonging to different age groups who play in government parks and the information is given as a histogram. Identify the number of children belonging to the age groups 2, 3, 4, 5, 6, and 7 who play in government parks.
|
A) 30 B) 28 C) 32 D) 35 |
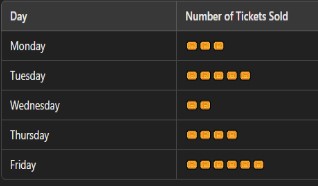
7 |
Calculate the total number of tickets sold over the five days?
|
A) 162 tickets B) 160 tickets C) 164 tickets D) 166 tickets |
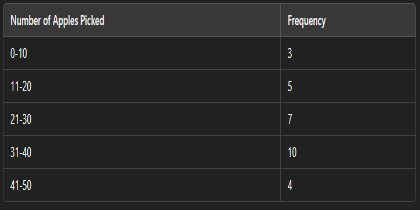
8 |
What percentage of workers picked 20 or fewer apples?
|
A) 26.90% B) 28.60% C) 27.60% D) 30.50% |
9 |
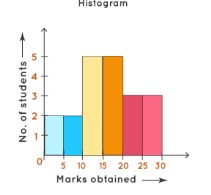
How many students are obtained 30 marks?
|
A) 4 students B) 5 students C) 3 students D) 2 students |
10 |
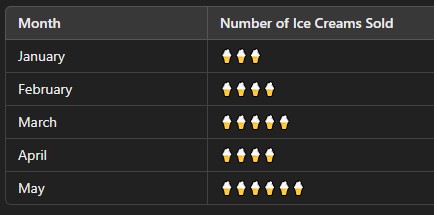
What is the average number of ice creams sold per month over the five months?
|
A) 50 icecreams B) 48 icecreams C) 46 icecreams D) 44 icecreams |
Copyright © 2020-2022 saibook.us Contact: info@saibook.us Version: 1.5 Built: 18-June-2024 09:20AM EST