Lesson Example Discussion Quiz: Class Homework |
Step-3 |
Title: Pictographs, Frequent Tables, Histograms |
Grade: 1300-a Lesson: S4-L8 |
Explanation: Hello Students, time to practice and review the steps for the problem. |
Lesson Steps
| Step | Type | Explanation | Answer |
|---|---|---|---|
1 |
Problem |
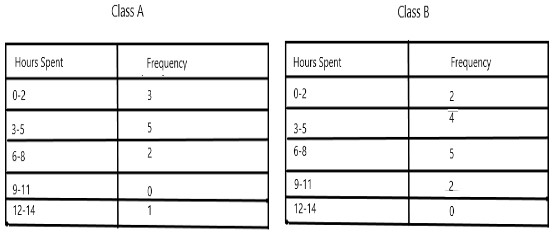
Which class has the highest number of students spending 6-8 hours on homework?
|
|
2 |
Step |
We are given the number of students in each class (Class-A and Class-B) who spend 6-8 hours on homework. |
|
3 |
Step |
Compare the data: |
|
4 |
Step |
Therefore, Class B has the highest number of students spending 6-8 hours on homework. |
|
5 |
Choice.A |
This option suggests that Class A has the highest number of students spending 6-8 hours on homework |
Class A |
6 |
Choice.B |
This is the correct answer based on the information you provided. It indicates that Class B has the most students in that specific time range |
Class B |
7 |
Choice.C |
This option implies that both Class A and Class B have the same number of students spending 6-8 hours on homework |
Both |
8 |
Choice.D |
This option suggests that neither Class A nor Class B has the most students in the 6-8 hour range. It’s possible both classes have very few students in that category, or another class (not mentioned) might have the most |
None |
9 |
Answer |
Option |
B |
10 |
Sumup |
Can you summarize what you’ve understood in the above steps? |
|
Copyright © 2020-2022 saibook.us Contact: info@saibook.us Version: 1.5 Built: 18-June-2024 09:20AM EST