Lesson Example Discussion Quiz: Class Homework |
Quiz At Home |
Title: Two-Variable Data |
Grade: 1300-a Lesson: S4-L2 |
Explanation: Hello Students, time to practice and review. Let us take next 10-15 minutes to solve the ten problems using the Quiz Sheet. Then submit the quiz to get the score. This is a good exercise to check your understanding of the concepts. |
Quiz: at Home
| Problem Id | Problem | Options |
|---|---|---|
1 |
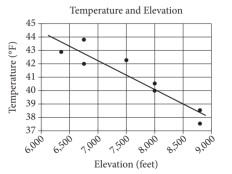
The scatterplot above shows the high temperature on a certain day and the elevation of 8 different locations in the Lake Tahoe Basin. A line of best fit for the data is also shown. What temperature is predicted by the line of best fit for a location in the Lake Tahoe Basin with an elevation of 8,500 feet?
|
A) 37°F B) 39°F C) 41°F D) 43°F |
2 |
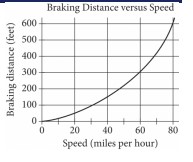
The graph above shows the relationship between the speed of a particular car, in miles per hour, and its corresponding braking distance, in feet. Approximately how many feet greater will the car’s braking distance be when the car is traveling at 50 miles per hour than when the car is traveling at 30 miles per hour?
|
A) 75 B) 125 C) 175 D) 250 |
3 |
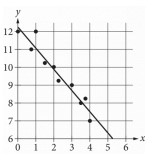
The scatterplot shows the relationship between two variables, x and y. A line of best fit for the data is also shown. Which of the following is closest to the difference between the y-coordinate of the data point x = 1 with and the y-value predicted by the line of best fit at x = 1 ?
|
A) 12 B) 7 C) 3 D) 1 |
4 |
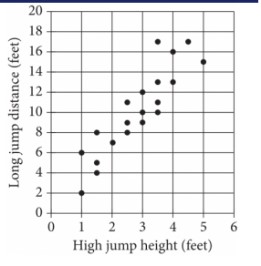
Each dot in the scatterplot above represents the height x, in feet, in the high jump, and the distance y, in feet, in the long jump, made by each student in a group of twenty students. The graph of which of the following equations is a line that most closely fits the data?
|
A) y = 0.82x - 3.30 B) y = 3.30x - 0.82 C) y = 0.82x + 3.30 D) y = 3.30x + 0.82 |
5 |
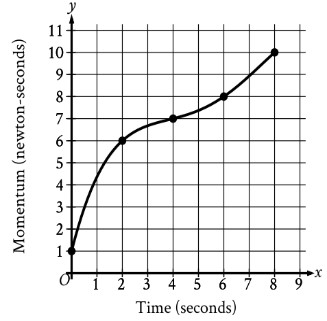
The graph shows the momentum y, in newton-seconds, of an object x seconds after the object started moving, for 0 ≤ x ≤ 8. What is the average rate of change, in newton-seconds per second, in the momentum of the object from x = 2 to x = 6?
|
A) \$ 1 / 5 \$ B) \$ 2 / 5 \$ C) \$ 1 / 2 \$ D) \$ 1 / 4 \$ |
6 |
Each year, the value of an investment increases by 0.49% of its value the previous year. Which of the following functions best models how the value of the investment changes over time? |
A) Decreasing exponential B) Decreasing linear C) Increasing exponential D) Increasing linear |
7 |
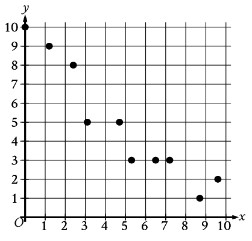
The scatterplot shows the relationship between two variables, x and y . Which of the following equations is the most appropriate linear model for the data shown?
|
A) y = 9.4 - 0.9x B) y = 9.4 + 0.9x C) y = 0.9 - 9.4x D) y = 0.9 + 9.4x |
8 |
For x < 0, which of the following is true about the values of |
A) As x decreases, the values of \$5^x\$ approach 0. B) As x increases, the values of \$5^x\$ approach 0. C) x = 0. D) As x increases, the values of \$5^x\$ approach 1. |
9 |
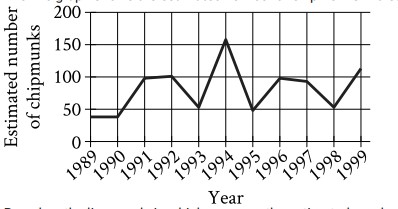
The line graph shows the estimated number of chipmunks in a state park on April 1 of each year from 1989 to 1999 . Based on the line graph , in which year was the estimated number of chipmunks in the state parks find the value of 1997.
|
A) 98 B) 95 C) 90 D) 103 |
10 |
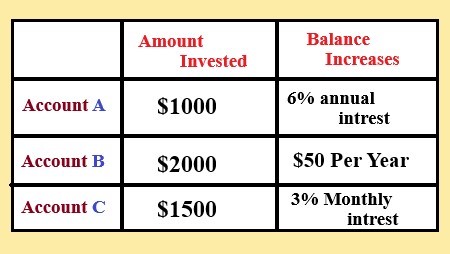
Three investments were made as shown in the table above. The interest in Account C is compounded once per month. Which of the following is true about the investments?
|
A) Account C always earns less money per month than Account B. B) Account C always earns more money per month than Account A and Account B. C) Account C earns more money per month than Account A at first but eventually earns less money per month. D) Account C earns less money per month than Account B at first but eventually earns more money per month. |
Copyright © 2020-2022 saibook.us Contact: info@saibook.us Version: 1.5 Built: 18-June-2024 09:20AM EST