Lesson Example Discussion Quiz: Class Homework |
Quiz In Class |
Title: Two-Variable Data |
Grade: 1300-a Lesson: S4-L2 |
Explanation: Hello Students, time to practice and review. Let us take next 10-15 minutes to solve the ten problems using the Quiz Sheet. Then submit the quiz to get the score. This is a good exercise to check your understanding of the concepts. |
Quiz: in Class
| Problem Id | Problem | Options |
|---|---|---|
1 |
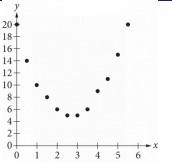
Of the following, which is the best model for the data in the scatterplot?
|
A) y = \$2 times "x"^2 - 11"x" - 20\$ B) y = \$2 \times "x"^2 - 11"x" + 20\$ C) y = \$2 times "x"^2 - 5"x" - 3\$ D) y = \$2 times "x"^2 - 5"x" + 3\$ |
2 |
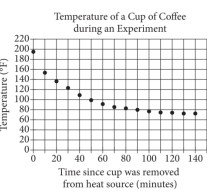
In an experiment, a heated cup of coffee is removed from a heat source, and the cup of coffee is then left in a room that is kept at a constant temperature. The graph above shows the temperature, in degrees Fahrenheit (°F), of the coffee immediately after being removed from the heat source and at 10-minute intervals thereafter. During which of the following 10-minute intervals does the temperature of the coffee decrease at the greatest average rate?
|
A) Between 30 and 40 minutes. B) Between 0 and 10 minutes. C) Between 50 and 60 minutes. D) Between 90 and 100 minutes. |
3 |
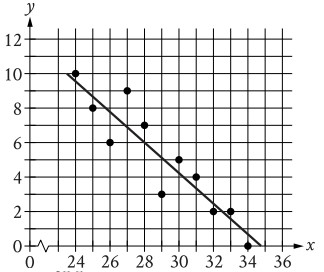
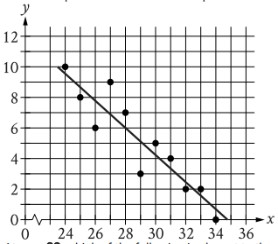
The scatterplot shows the relationship between two variables, x and y. A line of best fit for the data is also shown. At x = 25.5, which of the following is closest to the y-value predicted by the line of best fit?
|
A) 6.2 B) 7.3 C) 9.1 D) 8.2 |
4 |
The scatterplot shows the relationship between two variables x, and y. A line of best fit is also shown. Which of the following is closest to the slope of the line of best fit shown?
|
A) 2.4 B) 0.8 C) - 2.4 D) - 0.8 |
5 |
The scatterplot shows the relationship between two variables, x and y. A line of best fit for the data is also shown. At x = 32 , which of the following is closest to the y-value predicted by the line of best fit?
|
A) 0.4 B) 1.5 C) 2.4 D) 3.3 |
6 |
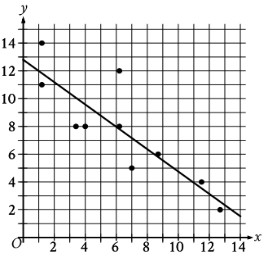
Which of the following could be the equation for a line of best fit for the data shown in the scatterplot above?
|
A) y = - 0.8x + 3 B) y = 0.8x + 3 C) y = 3x + 0.8 D) y = - 3x + 0.8 |
7 |
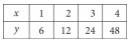
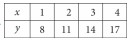
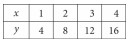
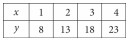
In which of the following tables is the relationship between the values of x and their corresponding y-values nonlinear? |
A) B) C) D) |
8 |
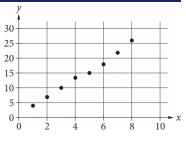
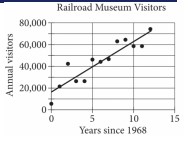
The scatterplot above shows the number of visitors to a railroad museum in Pennsylvania each year from 1968 to 1980, where t is the number of years since 1968 and n is the number of visitors. A line of best fit is also shown. Which of the following could be an equation of the line of best fit shown?
|
A) n = 16090 + 4680t B) n = 4690 + 16090t C) n = 16090 + 9060t D) n = 9060 + 16060t |
9 |
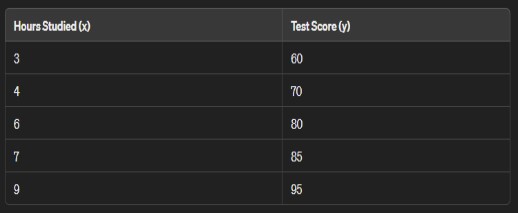
Suppose you have the following data representing the number of hours studied(x) and the corresponding test scores(y) for the group of students. Calculate the correlation coefficient between the number of hours studied and the test scores.
|
A) 2.36 B) 1.21 C) 3.25 D) 1.36 |
10 |
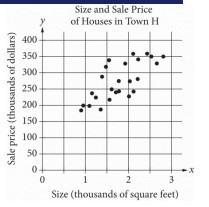
The scatterplot above shows the size x and the sale price y of 25 houses for sale in Town H. Which of the following could be an equation for a line of best fit for the data?
|
A) y = 200x + 100 B) y = 100x + 100 C) y = 50x + 100 D) y = 100x |
Copyright © 2020-2022 saibook.us Contact: info@saibook.us Version: 1.5 Built: 18-June-2024 09:20AM EST