Lesson Topics Discussion Quiz: Class Homework |
Steps-1 |
Title: Box Plots & Outlier Identification |
Grade Lesson s6-l6 |
Explanation: Hello Students, time to practice and review the steps for the problem. |
Quiz: Discussion Step
| Id | Type | Name | Note |
|---|---|---|---|
1 |
Problem |
The data set shows the prices (in dollars) of lacrosse helmets. Make a box-and-whisker plot that represents the data. Describe the distribution. 125, 120, 250, 110, 190, 220, 145, 260, 240, 150, 170, and 200. |
|
2 |
Step |
The given data is ordered in ascending order |
110, 120, 125, 145, 150, 170, 190, 200, 220, 240, 250, and 260 |
4 |
Step |
Constructing the Box-and-Whisker Plot: |
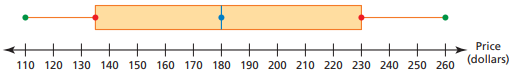
→ Draw a number line that covers the range of your data, from 110 to 260 → Draw a box from Q1 (135) to Q3 (230) → Draw a line inside the box at the median (180) → Extend "whiskers" from the edges of the box to the minimum value (110) and the maximum value (260) |
5 |
Step |
Description of the Distribution: |
→ The data is spread out with prices ranging from $110 to $260 → The middle 50% of the data (between Q1 and Q3) ranges from $135 to $230, showing a broad interquartile range (IQR) of 95 → The whiskers are almost symmetric around the median, suggesting a roughly symmetric distribution with no extreme outliers |
6 |
Sumup |
Please summarize steps |
|
Choices |
|||
7 |
Choice-A |
This plot correctly depicts a box-and-whisker plot for the lacrosse helmet price data. The minimum value (least price) is represented by the leftmost point on the number line. The box shows the spread of the data between Q1 and Q3. The line in the middle of the box represents the median (Q2). The whiskers extend from the box towards the minimum and maximum values, likely following the 1.5 IQR rule from the quartiles |
Correct
|
8 |
Choice-B |
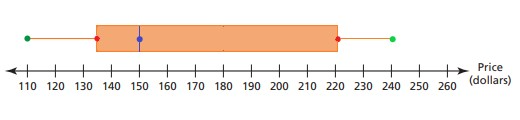
The box in this plot is wider than expected for the IQR, and the whiskers extend to data points that might be outliers but are included within the whiskers |
Wrong
|
9 |
Choice-C |
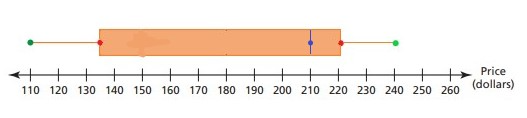
The median line is missing in the box, and the whiskers seem to extend beyond potential outliers |
Wrong
|
10 |
Choice-D |
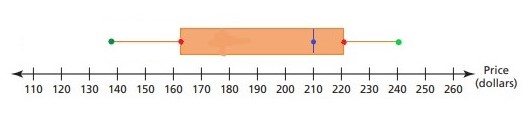
The box is too short, and the left whisker extends to a data point that likely falls within the 1.5 IQR range |
Wrong
|
11 |
Answer |
Option |
A |
12 |
Sumup |
Please summarize choices |
|
Copyright © 2020-2024 saibook.us Contact: info@saibook.org Version: 4.0 Built: 01-Apr-2025 12:00PM EST