Lesson Topics Discussion Quiz: Class Homework |
Quiz Discussion |
Title: Box Plots & Outlier Identification |
Grade Lesson s6-l6 |
Explanation: Let us discuss a few questions on this topic and review the answers to every question. |
Quiz: Discussion
| Id | Name | Note |
|---|---|---|
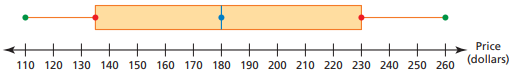
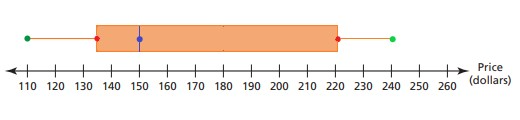
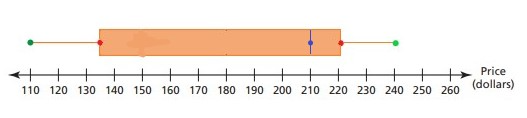
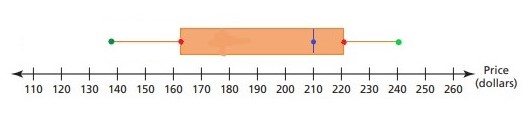
The data set shows the prices (in dollars) of lacrosse helmets. Make a box-and-whisker plot that represents the data. Describe the distribution: 125, 120, 250, 110, 190, 220, 145, 260, 240, 150, 170, and 200. |
A) B) C) D) |
|
Make a box-and-whisker plot that represents the data. Describe the distribution. Video game prices (in dollars): 45, 40, 50, 35, 30, 40, 40, 30, 45, and 6. |
A) Symmetric B) Skewed Left C) Skewed Right D) None of the above |
|
Find any outliers in the test scores for a class: 55, 63, 70, 72, 61, 75, 80, 120, 60, 74, 68, 77, 65, and 76. |
A) Outlier: 55 B) Outlier: 80 C) Outlier: 120 D) Outlier: 60 |
|
Find the interquartile range (IQR): 8, 12, 13, 19, 22, 25, 7, 14, 5, and 16. |
A) 11 B) 13 C) 9 D) 17 |
|
Identify any outlier(s) of the data set: 76, 72, 64, 93, 80, 78, 96, 75, 70, and 72. |
A) 94, 96 B) 93, 92 C) 95, 98 D) 93, 96 |
Copyright © 2020-2024 saibook.us Contact: info@saibook.org Version: 4.0 Built: 01-Apr-2025 12:00PM EST