Lesson Topics Discussion Quiz: Class Homework |
Definition1 |
Title: Statistics |
Grade Lesson s6-p2 |
Explanation: The best way to understand PSAT-4 is by looking at some definitions. Take turns and read each definition for easy understanding. |
Definition
Topics → Definition Example1 Example2
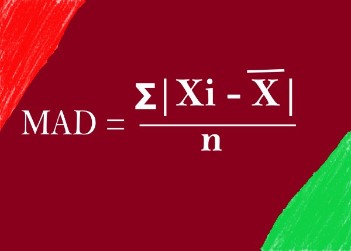
Definition: Mean Absolute Deviation |
|
The mean absolute deviation (MAD) of a data set is the average distance between each data value and the mean. MAD is a measure used to describe the variation in a data set. |
. |
Explanation: |
|
The provided image displays the formula for Mean Absolute Deviation. |
|
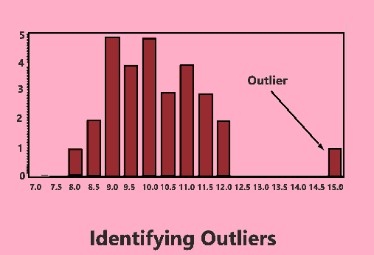
Definition: Identifying Outliers |
|
Identifying outliers means finding data points in a dataset that are very different from the rest. These unusual points stand out because they are much higher or lower than most of the other data. Finding outliers helps in understanding unusual patterns, errors, or unique occurrences in the data. |
. |
Explanation: |
|
The chart shows the distribution of recreational boating accidents, with "Outlier" indicating data points outside the expected distribution. |
|
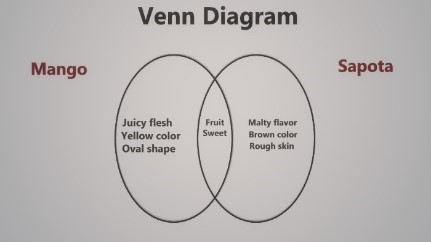
Definition: Venn Diagrams |
|
A Venn Diagram is a visual tool used to represent sets and their relationships to each other through overlapping circles or other shapes. Each circle represents a set, and the overlapping areas between circles represent the intersections of the sets, showing the common elements between them. |
. |
Explanation: |
|
This Venn diagram shows that mangoes and sapotas are both fruits, but they have some different characteristics. |
|
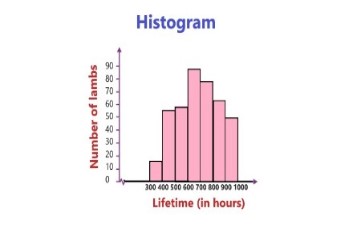
Definition: Histograms |
|
A histogram is a graph that shows the frequency of numerical data using rectangles. The height of a rectangle (the vertical axis) represents the distribution frequency of a variable (the amount, or how often that variable appears). |
. |
Explanation: |
|
The diagram you sent is a histogram titled "Number of lamps". The x-axis of the diagram shows the lifetime of the lamps in hours. The y-axis shows the number of lamps. |
|
Copyright © 2020-2024 saibook.us Contact: info@saibook.org Version: 4.0 Built: 23-Oct-2025 12:00PM EST