Lesson Topics Discussion Quiz: Class Homework |
Quiz At Home |
Title: Statistics |
Grade Lesson s6-p2 |
Explanation: Hello Students, time to practice and review. Let us take next 10-15 minutes to solve the ten problems using the Quiz Sheet. Then submit the quiz to get the score. This is a good exercise to check your understanding of the concepts. |
Quiz: at Home
| Id | Name | Note |
|---|---|---|
1 |
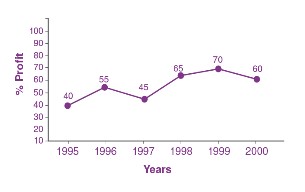
What was the percentage of profit in the year 1997? |
A) 45% B) 47% C) 49% D) 52% |
2 |
The following data represents the scores of 15 students in a physics quiz: 15, 18, 20, 21, 23, 25, 26, 28, 30, 32, 34, 36, 38, 40, and 42. Calculate the interquartile range. |
A) 11 B) 13 C) 17 D) 15 |
3 |
If a car originally costs $20,000 and depreciates by 10% each year, what will be its value after 3 years? |
A) $15,200 B) $14,580 C) $16,000 D) $15,000 |
4 |
A pictograph shows the number of books read by students in a class over a month. Each symbol represents 2 books.
What is the total number of books read by all students? |
A) 70 books B) 80 books C) 76 books D) 81books |
5 |
Identify any outliers in this set of bicycle ride durations (in minutes): 40, 45, 47, 50, 52, 55, 58, 60, 62, 63, 65, 67, 70, 72, 75, 80, 85, 90, and 150, using the 1.5 \$\times\$ IQR rule. |
A) Three outliers and the bicycle ride duration is 50 minutes. B) No outlier C) Two outliers and the bicycle ride duration is 100 minutes. D) One outlier and the bicycle ride duration is 150 minutes. |
6 |
The sample heights (in inches) of a group of 12 students are measured as follows: 60, 62, 65, 64, 61, 63, 68, 66, 67, 59, 63, and 70. Determine the standard deviation of these heights. |
A) 3.86 inches B) 4.97 inches C) 3.33 inches D) 5.18 inches |
7 |
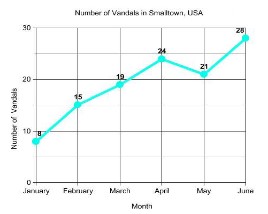
What was the month with the most Vandals? |
A) June B) March C) April D) May |
8 |
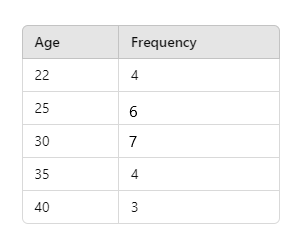
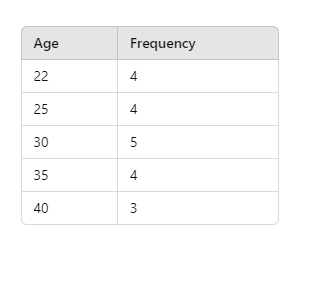
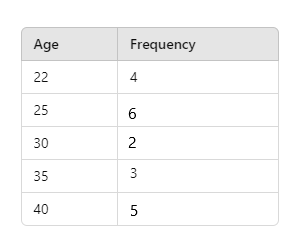
Create a frequency table to display the number of people in each age group for the following data: Ages - 22, 25, 30, 35, and 40, with corresponding frequencies of 4, 4, 5, 4, and 3. |
A) B) C) D) None of the above |
9 |
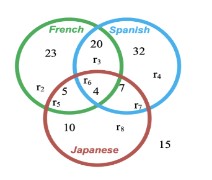
How many people can speak both French and Spanish but not Japanese? |
A) 24 B) 26 C) 20 D) 22 |
10 |
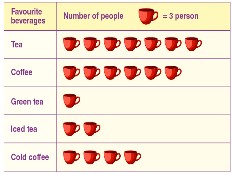
What is the number of people who prefer beverages, as shown in the pictograph? |
A) 60 B) 62 C) 16 D) 56 |

Copyright © 2020-2024 saibook.us Contact: info@saibook.org Version: 4.0 Built: 23-Oct-2025 12:00PM EST