Lesson Topics Discussion Quiz: Class Homework |
Steps-5 |
Title: Statistics |
Grade Lesson s6-p2 |
Explanation: Hello Students, time to practice and review the steps for the problem. |
Quiz: Discussion Step
| Id | Type | Name | Note |
|---|---|---|---|
1 |
Problem |
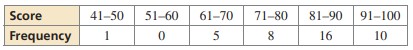
The frequency table shows the chemistry exam scores for a class. Display the data in a histogram. Describe the distribution.
|
|
2 |
Step |
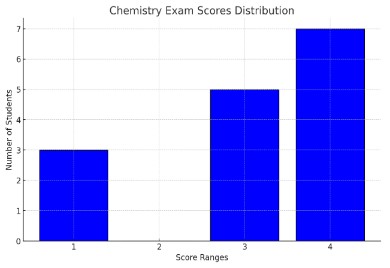
Histogram: |
We will plot: → Y-axis: Number of students. |
3 |
Step |
Description of Distribution: |
→ Shape: The distribution appears to be skewed right. Most students scored in the higher score ranges (3 and 4), with fewer students in the lowest range (1) and none in range 2. |
4 |
Step |
This description matches option 2’s indication that the distribution is correct. Let’s now plot the histogram for better visualization. |
|
5 |
Step |
The histogram above displays the distribution of the chemistry exam scores. From the histogram, we can describe the distribution as follows: |
Shape: The distribution is skewed right. This is indicated by most students scoring in the higher ranges (3 and 4). |
6 |
Solution |
Therefore, the description confirms that the histogram data is represented accurately by option 2. |
|
7 |
Sumup |
Please summarize Problem, Clue, Hint, Formula, Steps and Solution |
|
Choices |
|||
8 |
Choice-A |
This indicates that 3 students scored within the first score range |
Wrong 3 |
9 |
Choice-B |
This is important as it highlights the absence of students in the second score range, impacting the histogram’s shape and interpretation. This makes option 2 (0 students) the correct answer |
Correct 0 |
10 |
Choice-C |
This means that there are 5 students in one of the score ranges. In the histogram, this corresponds to the third score range |
Wrong 5 |
11 |
Choice-D |
There are 7 students in the fourth score range, so the bar corresponding to "4" reaches up to 7 on the Y-axis |
Wrong 7 |
12 |
Answer |
Option |
B |
13 |
Sumup |
Please summarize choices |
|
Copyright © 2020-2024 saibook.us Contact: info@saibook.org Version: 4.0 Built: 23-Oct-2025 12:00PM EST