Lesson

Title: Geometric distribution

Grade: 9-a Lesson: S4-L6

Explanation: Hello students, let us learn a new topic in statistics today with definitions, concepts, examples, and worksheets included.

Lesson:

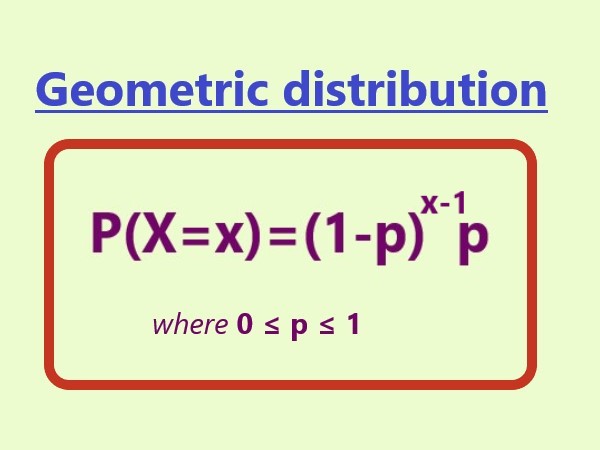
Definition: Geometric distribution:

  • Geometric distribution can be defined as a discrete probability distribution that represents the probability of getting the first success after having a consecutive number of failures

n = number of experiments,

p = Probability of success in any experiment,

q= Probability of failures in any experiment,

x = number of successful trials.

Notation: X ∼ G(p)

1

Explanation:

Applications of binomial distribution:

  • A worker opening oysters to look for pearls counts the number of oysters she has to open until she finds the first pearl.

  • A supervisor at the end of an assembly line counts the number of nondefective items produced until he finds the first defective one.

  • An electrician inspecting cable one yard at a time for defects counts the number of yards she inspects before she finds a defect.

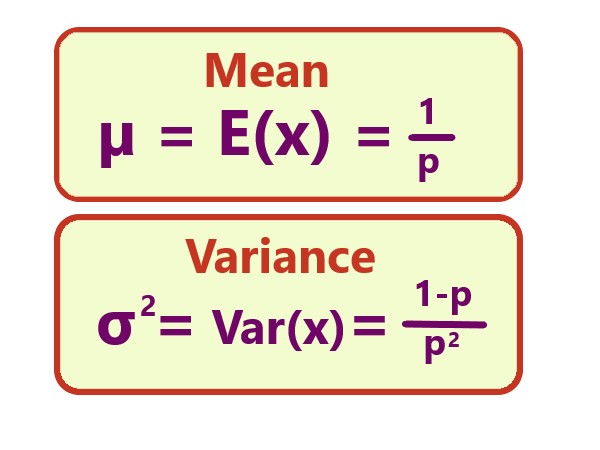
Definition: Mean and variance of geometric distribution:

  • The mean of geometric distribution is also the expected value, X, can be defined as the weighted average of all values of X

  • Variance can be defined as a measure of dispersion that checks how far the data in a distribution is spread out with respect to the mean

  • The standard deviation can be defined as the square root of the variance.

2

Explanation:

Properties of Binomial Distribution:

  • There are n repeated trials.

  • Each trial has two possible outcomes, in general known as "success" and "failure."

  • Trials are repeated until a predetermined number of successes is reached.

  • All trials are identical and independent; thus the probability for success remains the same for each trial.


Copyright © 2020-2022 saibook.us Contact: info@saibook.us Version: 1.5 Built: 27-February-2023 06:00 AM EST